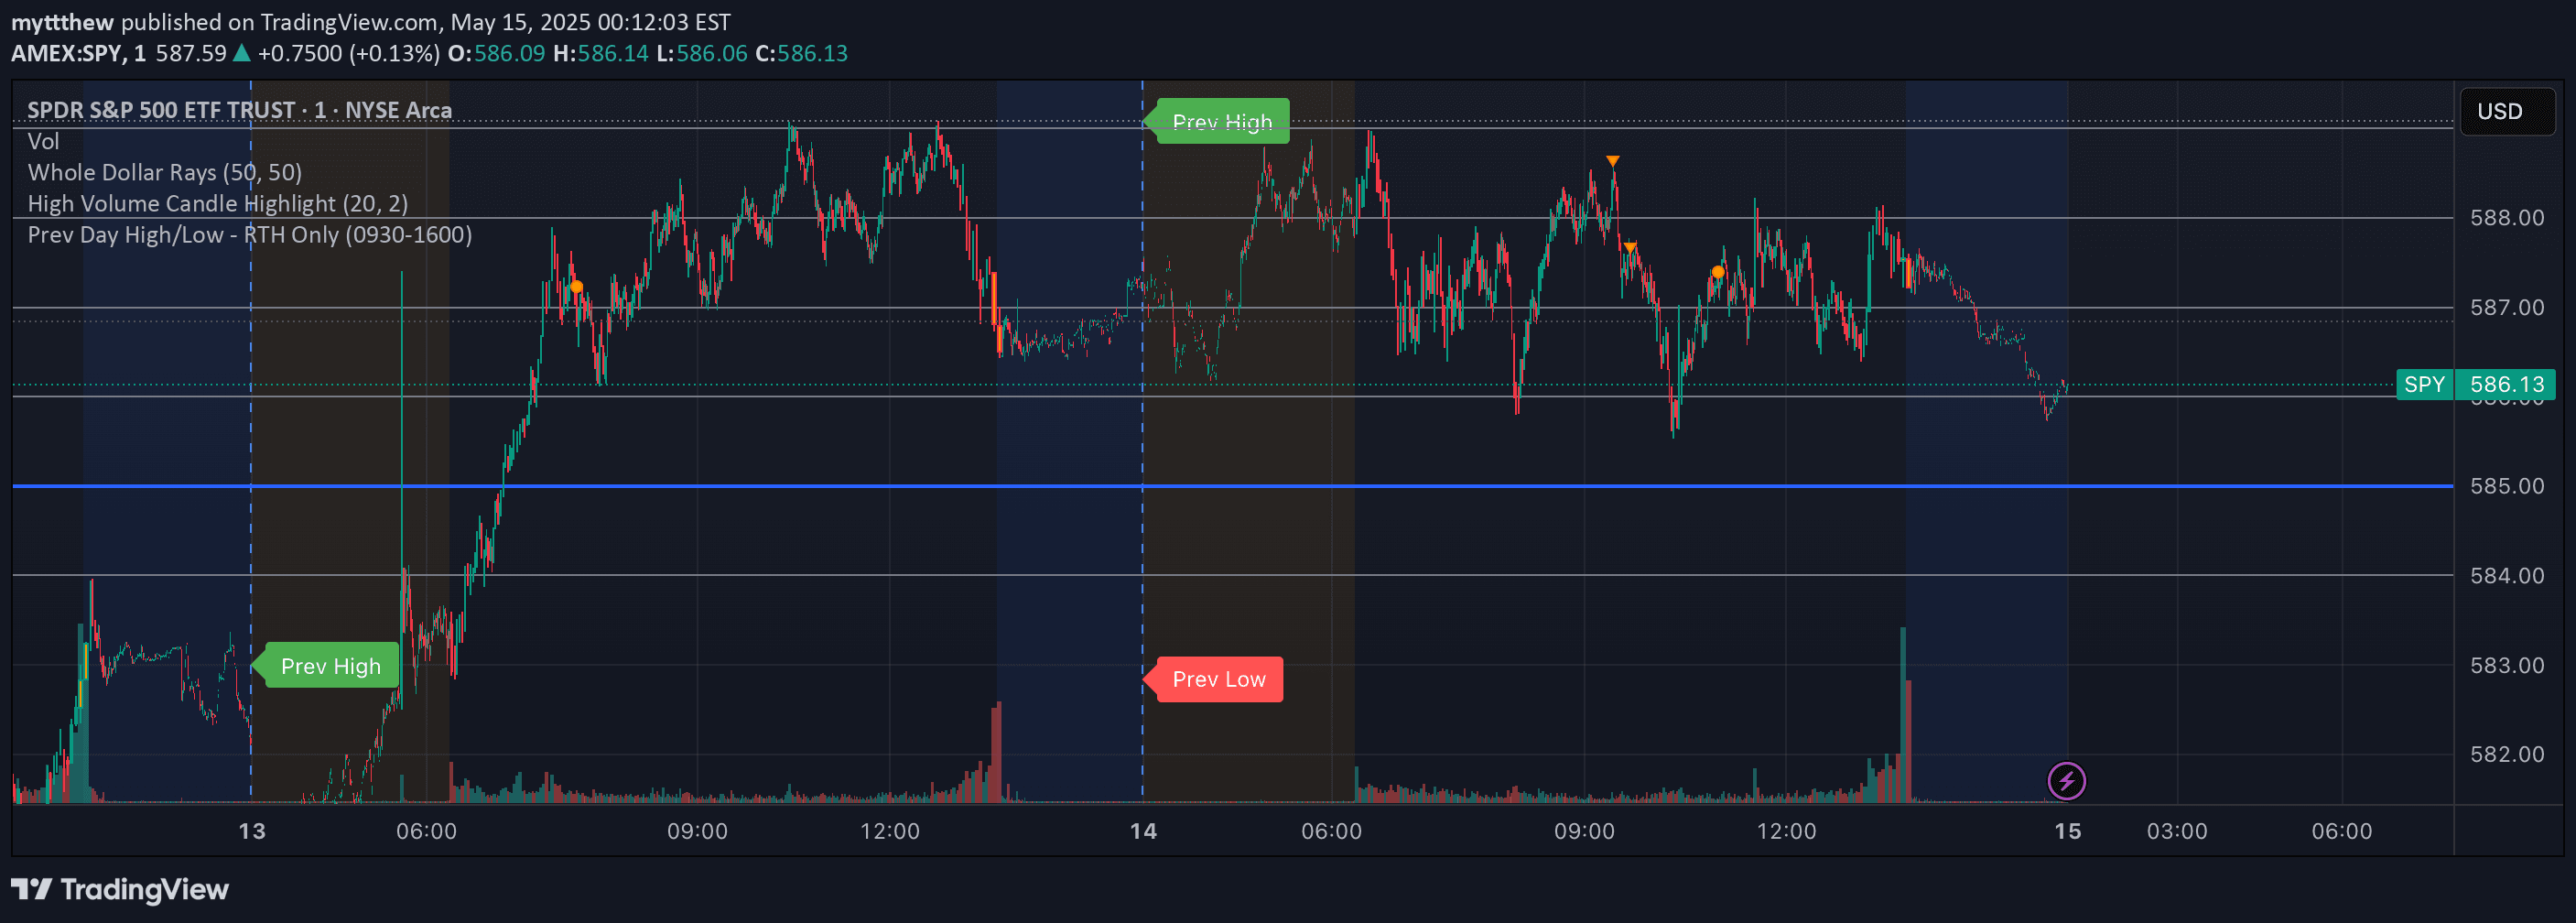
Percentage zones help traders identify critical price levels by measuring percentage changes from a reference point, providing insights into potential support, resistance, and price reversal zones.
Explore complementary indicator rolesHow it works
Percentage zones are created by calculating specific percentage levels above or below a reference point, such as an opening price or a previous price movement. These zones are typically established at predefined intervals like 1%, 2%, 5%, or 10%, creating a grid of potential support and resistance levels on a price chart.
Traders can customize these zones for different financial markets, with specific default settings for crypto and forex markets. By plotting these percentage levels, traders can visually identify key price areas where the asset might experience potential trend reversals, price consolidation, or significant market movements.
Why it may be useful
Percentage zones provide traders with a systematic approach to understanding price dynamics by breaking down market movements into measurable increments. These zones offer a clear visual representation of potential price barriers, helping traders make more informed decisions about entry, exit, and risk management strategies.
By establishing these percentage-based levels, traders can develop a more structured method of analyzing price action, reducing emotional decision-making and providing a quantitative framework for interpreting market behavior. The zones can be easily combined with other technical analysis tools to enhance overall trading strategy and market understanding.
When to explore it
Percentage zones are most effective in markets with clear trending or range-bound characteristics, where price movements tend to respect specific percentage-based levels. They are particularly useful in volatile markets like cryptocurrency and forex, where rapid price changes can create multiple opportunities for strategic trading.
Traders should use these zones in conjunction with other technical indicators to confirm potential trade setups, validate support and resistance levels, and identify potential trend reversals. They are especially valuable during periods of market uncertainty, helping traders establish more precise entry and exit points based on quantifiable price movements.
Keep exploring
What we’ve verified
Access, alerts and repainting behaviour have not been independently verified for this indicator. Check the creator’s current publication and settings.
General descriptions and classifications are recovered research. Verified details above identify the specific checks we have completed. Check the creator’s current publication for later changes.