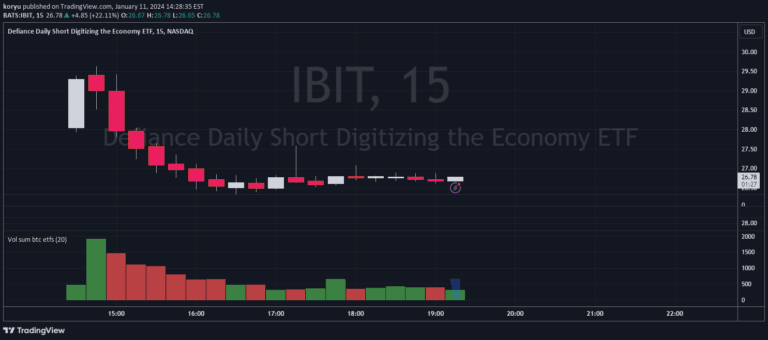
Bitcoin ETF capital flow indicator tracking daily net volume across 8 major spot ETFs to help traders understand potential buying and selling pressure in the BTC market.
Explore complementary indicator rolesHow it works
The indicator calculates net daily capital flows by analyzing volume data from 8 major Bitcoin spot ETFs, including GBTC, ARKB, FBTC, and others. It uses 5-minute chart data to derive net volume for each ETF by multiplying trading volume with the average price period.
The daily capital flow values for each ETF are aggregated to produce a total daily capital flow, which is then displayed as column charts. Additionally, the indicator calculates a cumulative sum of previous periods, presenting this information as a line chart to provide a comprehensive view of capital movement.
Why it may be useful
This indicator offers a unique, consolidated view of capital flows across major Bitcoin spot ETFs, providing traders with critical insights into market sentiment and potential buying or selling pressure. By aggregating data from multiple ETFs, it creates a more comprehensive picture of institutional and investor interest in Bitcoin.
The detailed analysis of capital flows can help traders understand underlying market dynamics, potentially revealing trends and momentum that might not be immediately apparent from price action alone. Its ability to track net volume across different ETFs makes it a valuable tool for assessing broader market sentiment.
When to explore it
The Bitcoin ETF capital flow indicator is most effective during periods of significant market movement or when evaluating institutional interest in cryptocurrency. Traders can use this tool to gauge potential trend reversals, confirm existing market trends, or identify shifts in investor sentiment.
It is particularly useful for day traders and swing traders who want to understand the broader market context beyond price movements. The indicator can help in making more informed decisions about entry and exit points by providing insights into capital flows across multiple Bitcoin spot ETFs.
Keep exploring
What we’ve verified
Access, alerts and repainting behaviour have not been independently verified for this indicator. Check the creator’s current publication and settings.
General descriptions and classifications are recovered research. Verified details above identify the specific checks we have completed. Check the creator’s current publication for later changes.