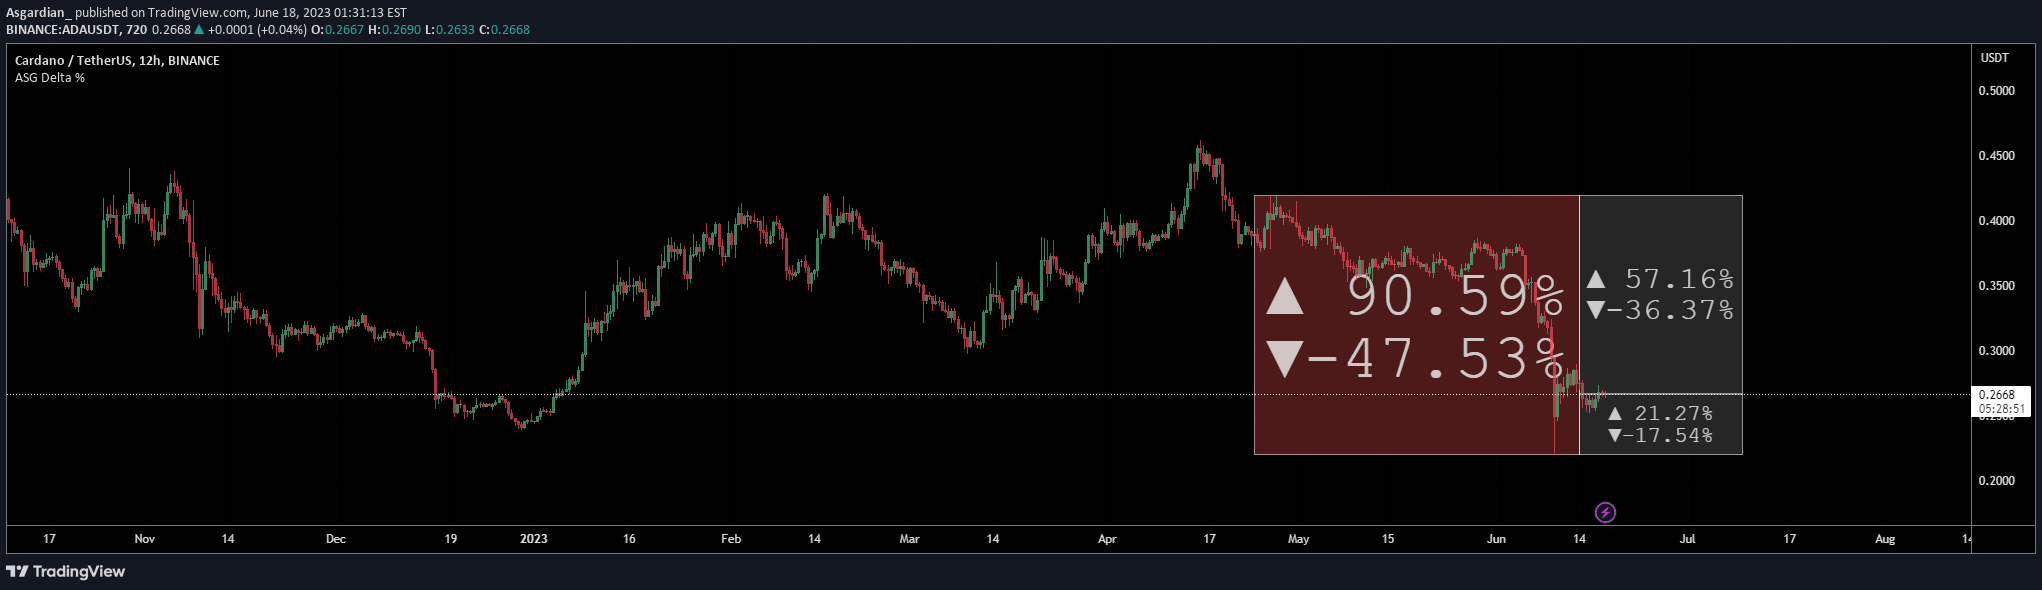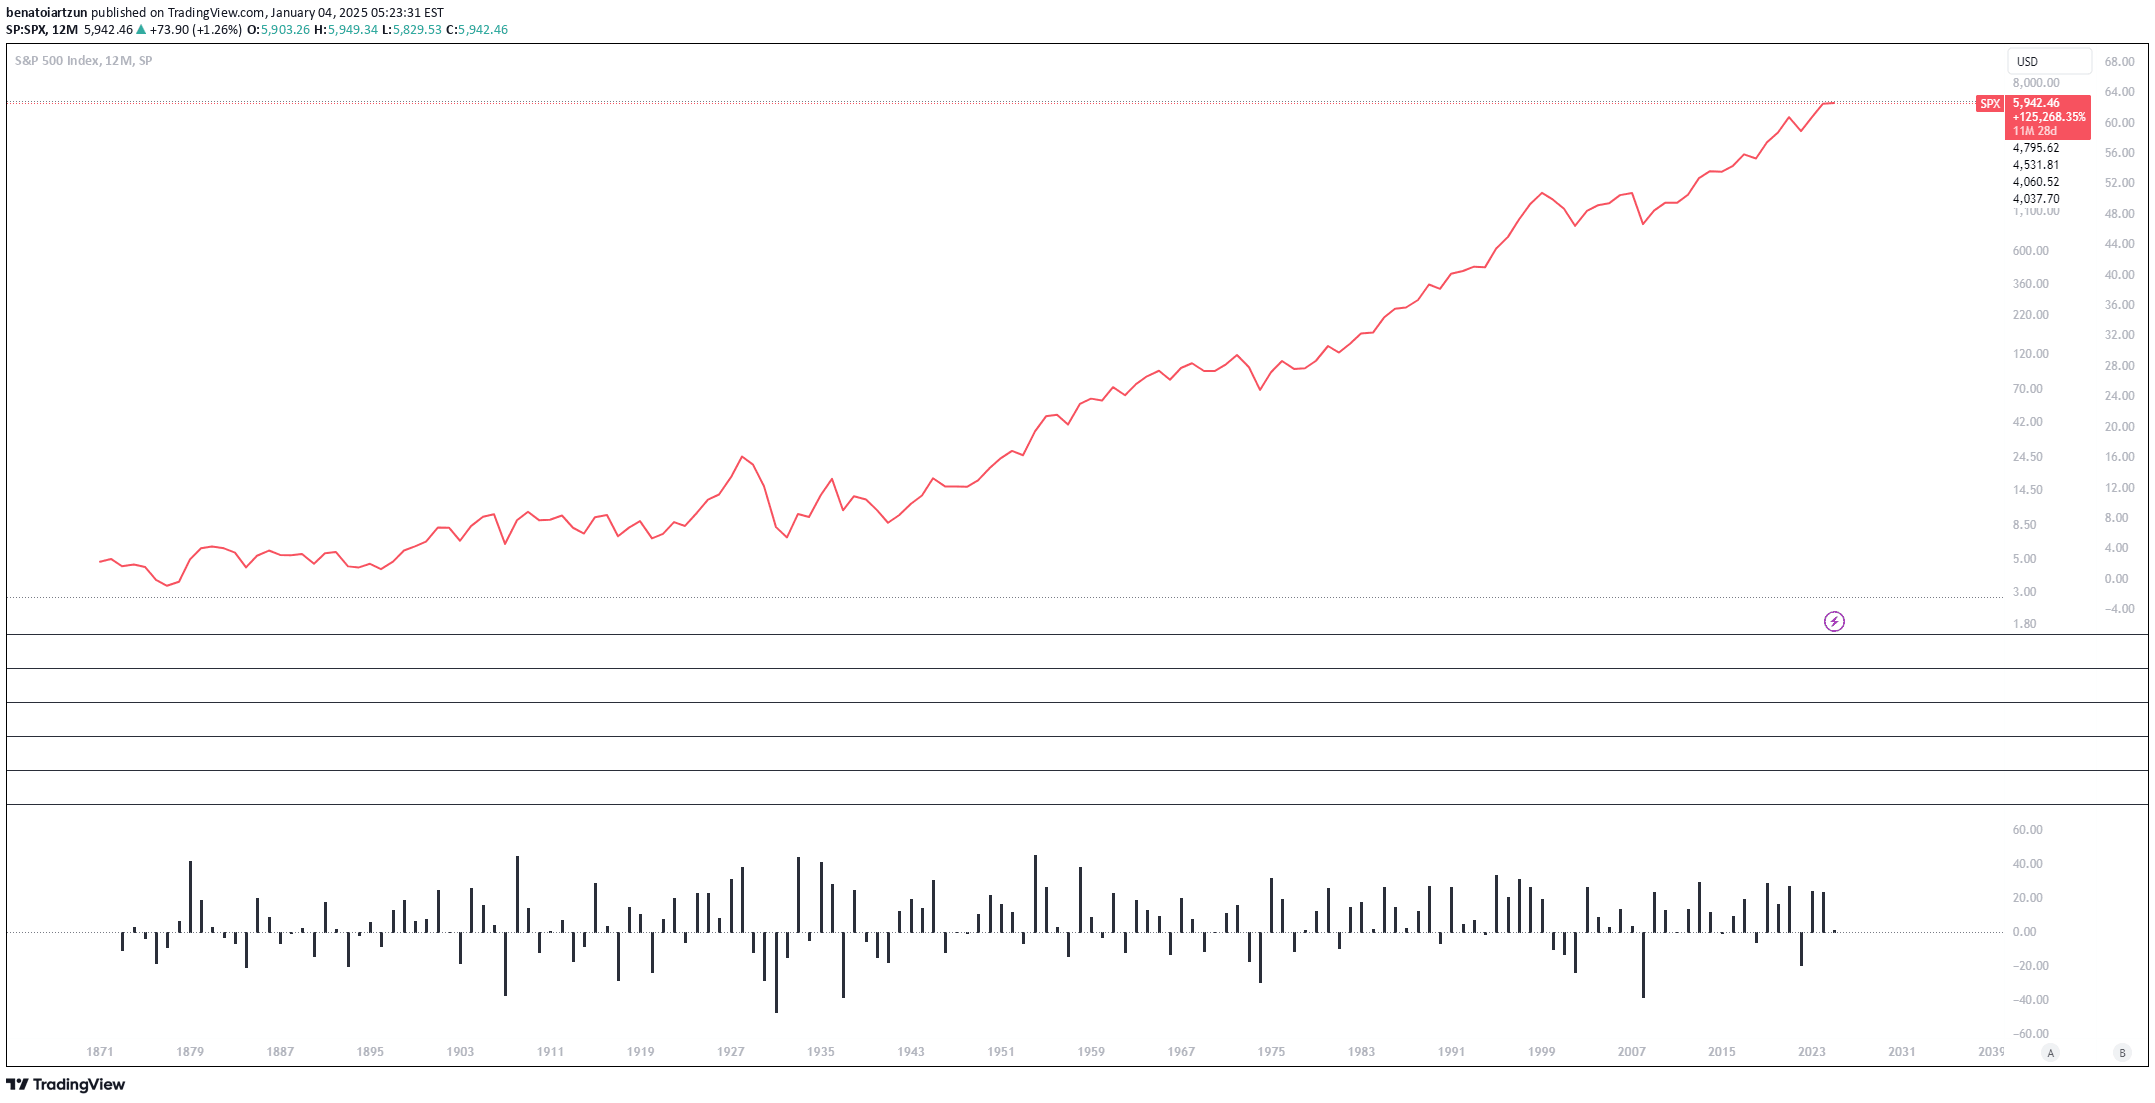
A data transformer for TradingView that converts stock symbols into various percentage and comparative change metrics, allowing flexible financial analysis across different time periods.
Explore complementary indicator rolesHow it works
The data transformer works by taking a stock's original symbol and generating multiple transformation options for analyzing price changes. Users can select from different comparative metrics like percentage change, quarter-over-quarter change, year-over-year change, and cumulative performance.
These transformations provide traders with multiple perspectives on price movement beyond traditional charting. By converting raw price data into comparative formats, the tool enables quick visual and numerical assessments of stock performance across various timeframes and calculation methods.
Why it may be useful
This data transformer provides traders with enhanced analytical flexibility by presenting financial data in multiple interpretative formats. It allows rapid understanding of price dynamics through different computational lenses, helping traders quickly assess performance trends and comparative movements.
By offering transformative views of financial data, the tool reduces manual calculation time and provides instant insights into stock performance. Traders can more efficiently evaluate investment potential by seeing percentage changes, quarterly comparisons, and cumulative performance in a single view.
When to explore it
The data transformer is most effective when analyzing stocks with complex performance histories or comparing assets across different timeframes. It becomes particularly useful during earnings seasons, market transitions, or when evaluating long-term investment strategies.
Traders can leverage this tool when conducting fundamental analysis, screening potential investments, or developing comparative investment approaches. It provides valuable context for understanding price movements beyond simple linear charts, enabling more nuanced financial decision-making.
Keep exploring
What we’ve verified
Access, alerts and repainting behaviour have not been independently verified for this indicator. Check the creator’s current publication and settings.
General descriptions and classifications are recovered research. Verified details above identify the specific checks we have completed. Check the creator’s current publication for later changes.