
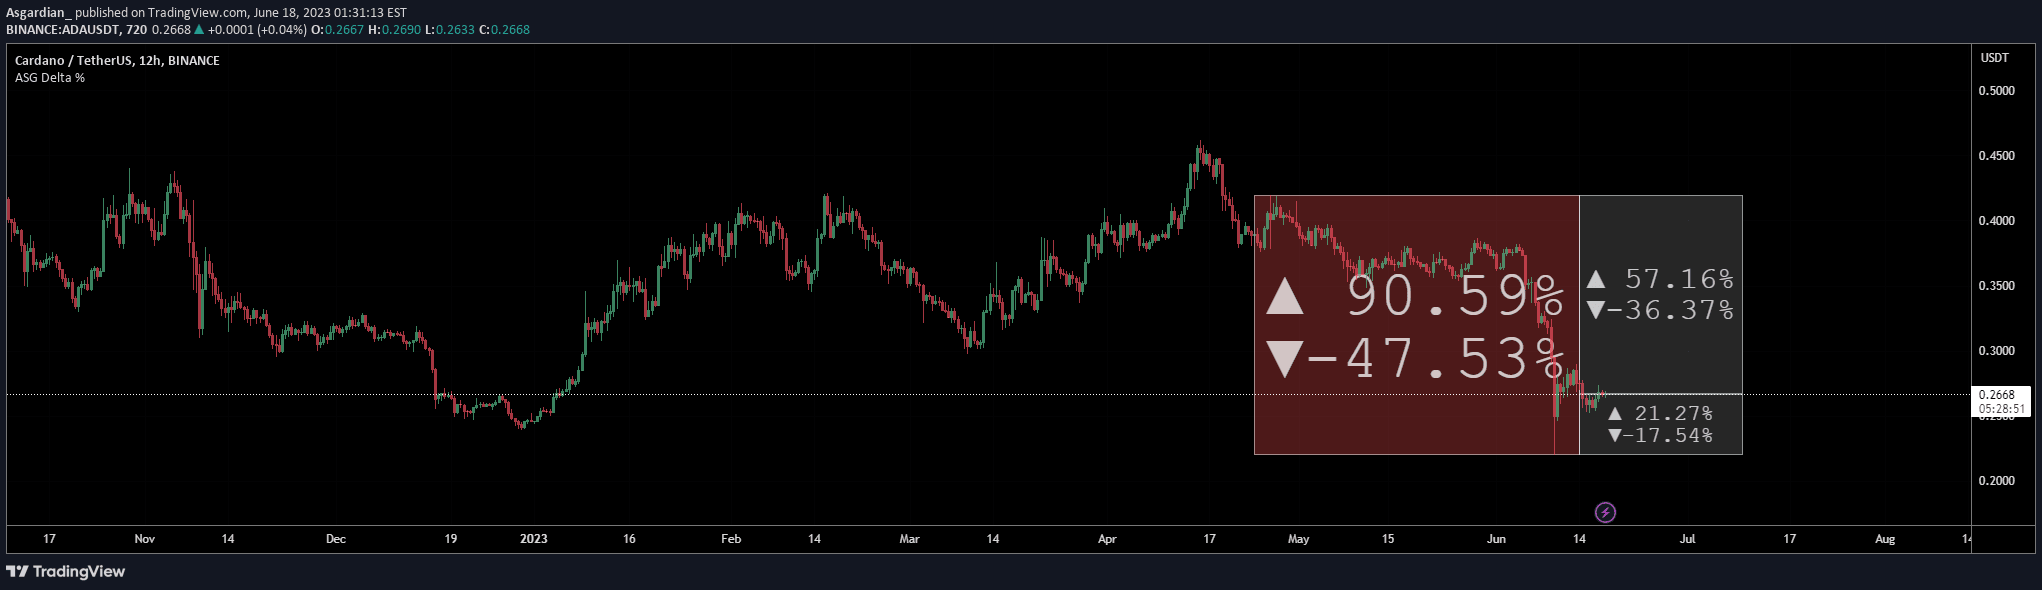
A utility script for calculating token price percentage changes within a custom date range, helping traders identify potential trading opportunities by visualizing price movements.
Explore complementary indicator rolesHow it works
The script calculates percentage gains or drops by identifying the highest and lowest price points within a user-defined date range. It analyzes the token's price movement, comparing the current price against historical performance during the selected timeframe.
By generating a visual representation through a bullish or bearish box, the script displays the percentage change (delta %) and provides additional insights. Users can toggle between normal and reverse modes to understand potential gains or losses from different price perspectives.
Why it may be useful
This script eliminates the need for manual chart analysis, saving traders significant time and effort in tracking token price movements. It provides a quick, comprehensive overview of price performance, enabling faster decision-making and more efficient market scanning.
By offering both current and potential future perspective on price changes, the utility helps traders quickly assess investment opportunities. The visual representation and percentage calculations make complex price movement data more accessible and easier to interpret.
When to explore it
The script is most effective during volatile market conditions when rapid price changes are common, such as during bull or bear markets. Traders can use it to scan multiple tokens quickly, identifying those with significant price movements that might present trading opportunities.
It is particularly useful for day traders, swing traders, and scalpers who need to make quick, data-driven decisions. The tool can help in comparing different tokens' performance and understanding potential entry or exit points based on historical price trends.
Keep exploring
What we’ve verified
Access, alerts and repainting behaviour have not been independently verified for this indicator. Check the creator’s current publication and settings.
General descriptions and classifications are recovered research. Verified details above identify the specific checks we have completed. Check the creator’s current publication for later changes.


