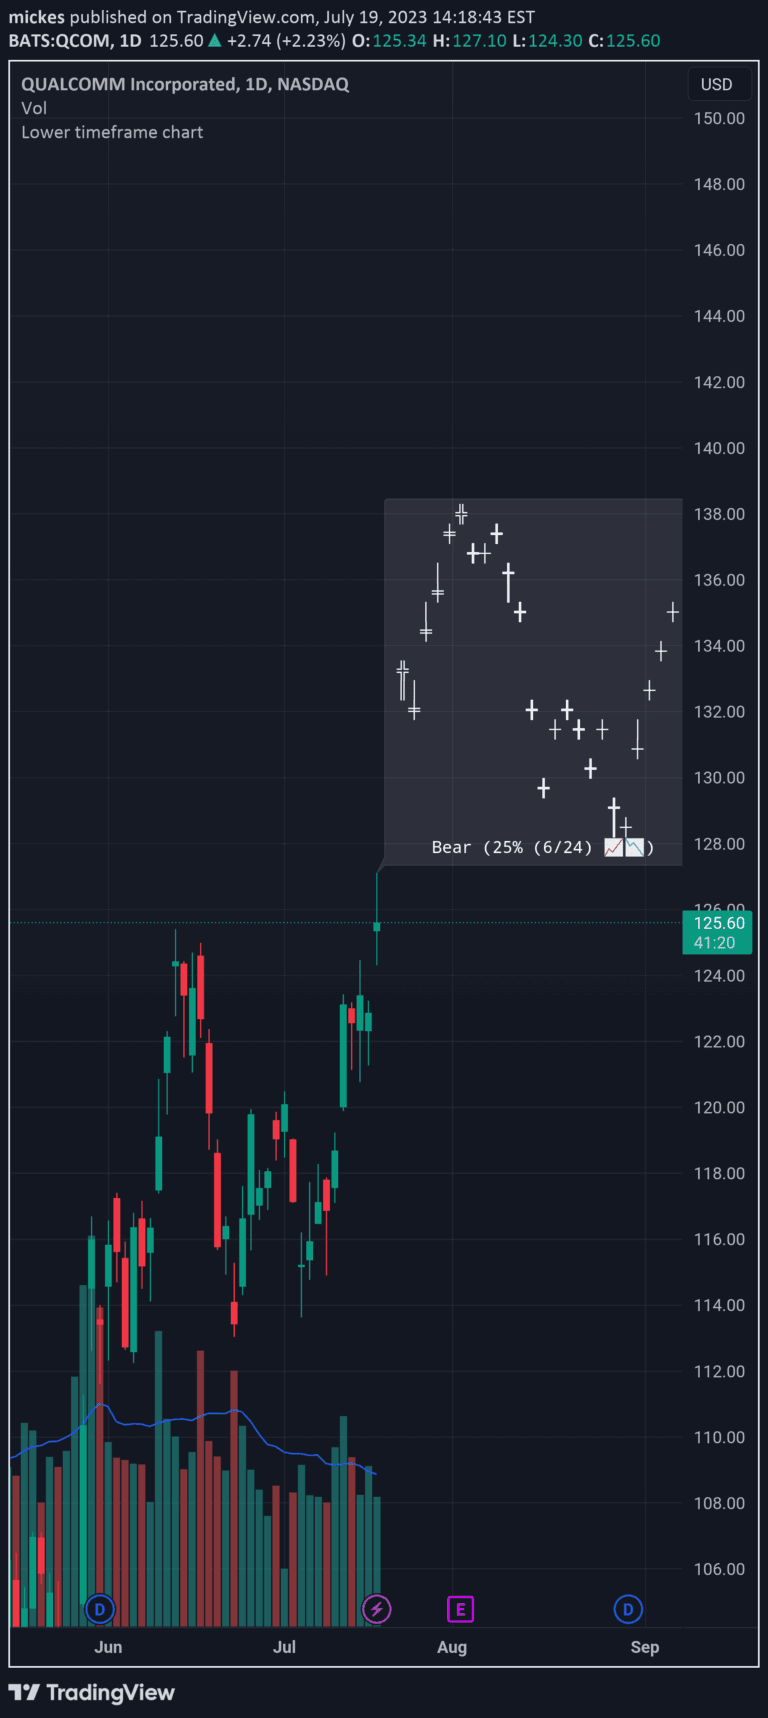
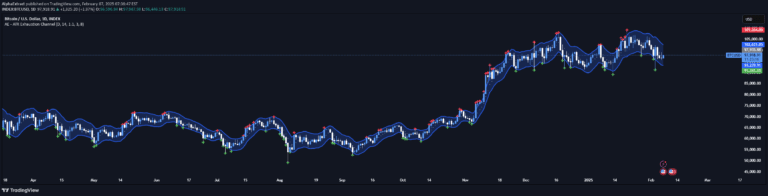
A price movement indicator that displays percentage changes of current bar prices relative to the previous bar's close, helping traders visualize price amplitude and movement dynamics.
Explore complementary indicator rolesHow it works
The script first retrieves the closing price of the previous bar as a reference point for calculation. It then computes percentage changes for open, high, low, and close prices of the current bar by comparing them to the previous bar's closing price.
The indicator transforms raw price data into percentage-based representations, allowing traders to see price movements in a standardized format. It creates color-coded visual representations (green for bullish, red for bearish) and offers flexibility in display type, either as candles or bars.
Why it may be useful
By converting price movements into percentage terms, traders can more easily compare and understand price dynamics across different financial instruments and timeframes. This normalization helps identify relative price changes, making it easier to assess market momentum and potential trend shifts.
The indicator provides a clear, visually intuitive method of tracking price movements, enabling traders to quickly recognize significant price fluctuations and potential trading opportunities without getting lost in absolute price values.
When to explore it
This indicator is most effective during periods of market volatility, where understanding relative price movements becomes crucial for making informed trading decisions. It works particularly well in fast-moving markets where quick visual assessment of price changes can provide a trading edge.
Traders should use this tool when comparing price movements across different timeframes or when they want a quick, percentage-based view of market dynamics. It is especially useful for short-term trading strategies that require rapid interpretation of price action.
Keep exploring
What we’ve verified
Access, alerts and repainting behaviour have not been independently verified for this indicator. Check the creator’s current publication and settings.
General descriptions and classifications are recovered research. Verified details above identify the specific checks we have completed. Check the creator’s current publication for later changes.