Indicator Panel
A dynamic trading panel displaying multiple technical indicators in a color-coded table format, allowing traders to quickly assess market conditions across multiple symbols simultaneously.
Explore 11,183 indicators. Filter beyond the obvious.
Discover the tools that fit the way you trade.
11,183 tools to explore
A dynamic trading panel displaying multiple technical indicators in a color-coded table format, allowing traders to quickly assess market conditions across multiple symbols simultaneously.
A trading signal that finds the most similar historical price sequences and projects future price movements using multiple similarity and correlation measures.
A custom trading tool that generates monthly and yearly performance tables for trading strategies, helping traders analyze historical strategy performance and identify key periods of success or weakness.
The Bollinger Band Width Percentile measures relative volatility by calculating the percentage of historical periods where Bollinger Band width was narrower than the current period.
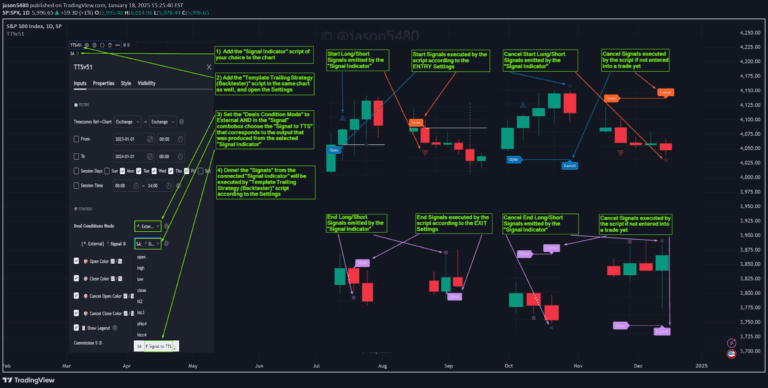
A flexible trading strategy framework enabling traders to develop, test, and evaluate custom trading logic with advanced signal management and comprehensive configuration options.
A comprehensive price conversion tool for SPY, SPX, ES, and SPX500USD traders to synchronize and analyze price levels across multiple linked instruments.
A currency strength indicator that measures relative performance of currencies by comparing their exchange rates and tracking their strength over time using a specialized meter and scatter plot.
A relative strength indicator comparing a stock's performance to an index by measuring the distance from moving averages, providing insights into comparative market behavior.
Asset Rotation Aperture tracks volume accumulation across multiple assets, visualizing capital rotation and market narratives through normalized cumulative volume lines.
A correlation matrix tool that visualizes relationships between 10 different assets, revealing how different securities move in relation to each other using statistical coefficients.
A financial analysis tool that compares quarterly, annual, and TTM performance metrics, providing comprehensive insights into company growth through various financial indicators and visualization options.
A Pine Script tool for calculating Compound Annual Growth Rate (CAGR) by interactively selecting two time points on a chart, providing an annualized performance metric.
Likes, views, and comments are historical TradingView snapshots. They describe attention, not trading performance.