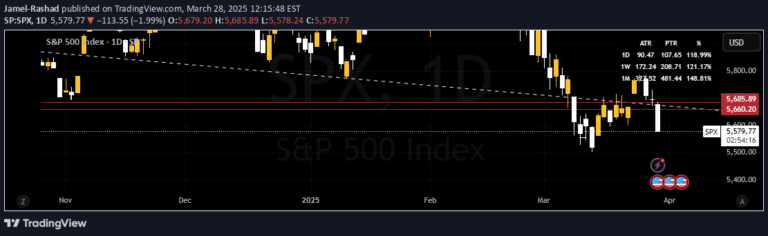
A trading indicator that calculates and displays the high-low price differences across specified periods, visualizing market volatility through color-coded candle analysis.
Explore complementary indicator rolesHow it works
The indicator analyzes price movement by calculating the difference between the highest and lowest prices for a user-defined number of periods. It creates a table that displays these high-low differences for each selected candle, providing a clear visual representation of price range and volatility.
The table allows traders to customize the number of periods and its screen placement. Each candle's high-low difference is calculated and color-coded based on the candle's direction: green for bullish, red for bearish, and white for neutral candles. An additional feature includes displaying the average high-low difference in yellow text.
Why it may be useful
This indicator helps traders quickly assess market volatility and price movement range by presenting high-low differences in an easily digestible format. The color-coding system provides immediate visual insights into market sentiment and potential price dynamics, allowing traders to make more informed decisions.
By highlighting the average high-low difference, the tool enables traders to understand the typical price fluctuation in recent market periods. This information is crucial for setting stop-loss levels, identifying potential entry and exit points, and understanding the current market's trading characteristics.
When to explore it
This indicator is most effective during periods of active market movement, particularly in volatile trading environments where price ranges are significant. Traders can use it to quickly assess recent price action and understand the market's current trading behavior across different timeframes.
It is especially useful for short-term traders who need to make rapid decisions based on recent price movements. Scalpers and day traders can benefit from its real-time volatility insights, helping them identify potential trading opportunities and manage risk more effectively.
Keep exploring
What we’ve verified
Access, alerts and repainting behaviour have not been independently verified for this indicator. Check the creator’s current publication and settings.
General descriptions and classifications are recovered research. Verified details above identify the specific checks we have completed. Check the creator’s current publication for later changes.