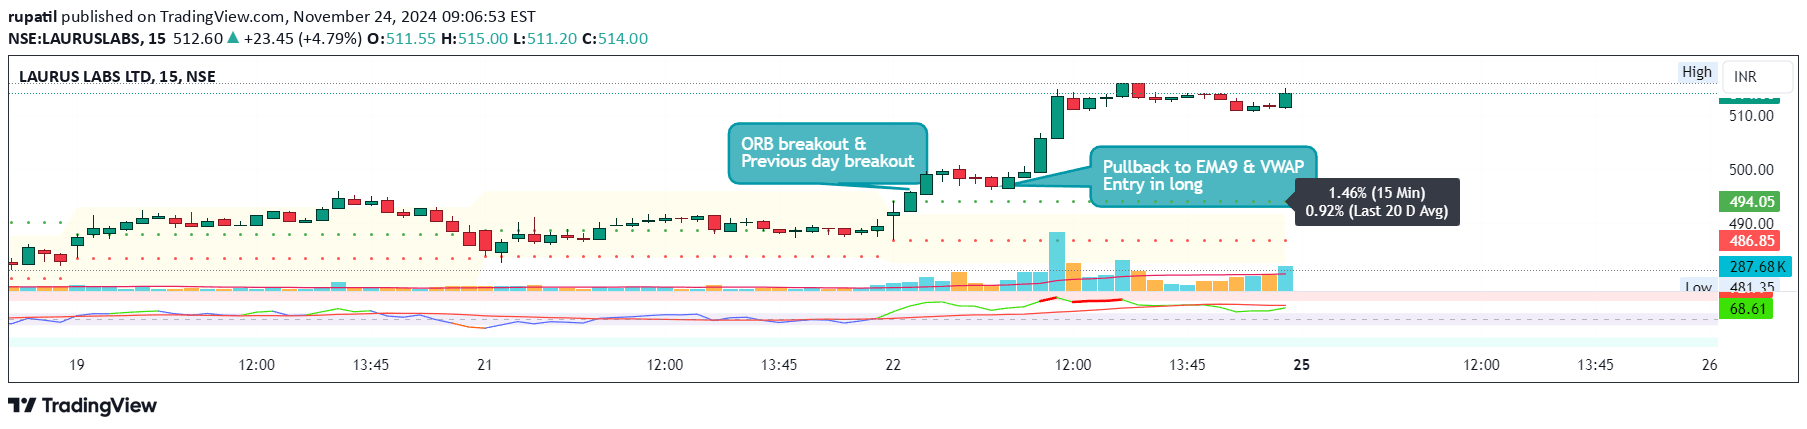
Day Break Lines Indicator visually marks the start of a new trading day with customizable vertical lines, helping traders identify daily trading sessions and transitions.
Explore complementary indicator rolesHow it works
The Day Break Lines Indicator automatically detects the beginning of each new trading day and draws vertical lines across the entire chart height. It uses time-based algorithms to precisely identify the transition between trading sessions, ensuring accurate placement of these visual markers.
Traders can customize the lines' appearance by selecting specific attributes like color, width, and line style. This flexibility allows users to adapt the indicator to their preferred visual style and chart setup, making it a versatile tool for identifying daily trading session boundaries.
Why it may be useful
The Day Break Lines Indicator provides traders with a clear visual representation of daily trading session transitions, which is crucial for understanding market dynamics and structuring trading strategies. By highlighting the start of each trading day, it helps traders quickly recognize potential shifts in market sentiment and price action.
Visual segmentation of trading days enables more precise analysis of intraday movements and supports better decision-making. The customizable nature of the lines allows traders to integrate this tool seamlessly into their existing chart analysis techniques, enhancing overall trading visualization.
When to explore it
The Day Break Lines Indicator is most effective for intraday traders who focus on short-term price movements and need clear visual demarcations of trading sessions. It is particularly useful in markets with distinct trading hours, such as stocks, futures, and forex, where understanding daily transitions is critical for strategic entry and exit points.
Traders can benefit from this indicator when analyzing multiple timeframes, comparing daily performance, or seeking to identify potential trend changes at the beginning of new trading sessions. Its adaptability makes it valuable for both novice and experienced traders looking to enhance their technical analysis approach.
Keep exploring
What we’ve verified
Access, alerts and repainting behaviour have not been independently verified for this indicator. Check the creator’s current publication and settings.
General descriptions and classifications are recovered research. Verified details above identify the specific checks we have completed. Check the creator’s current publication for later changes.