
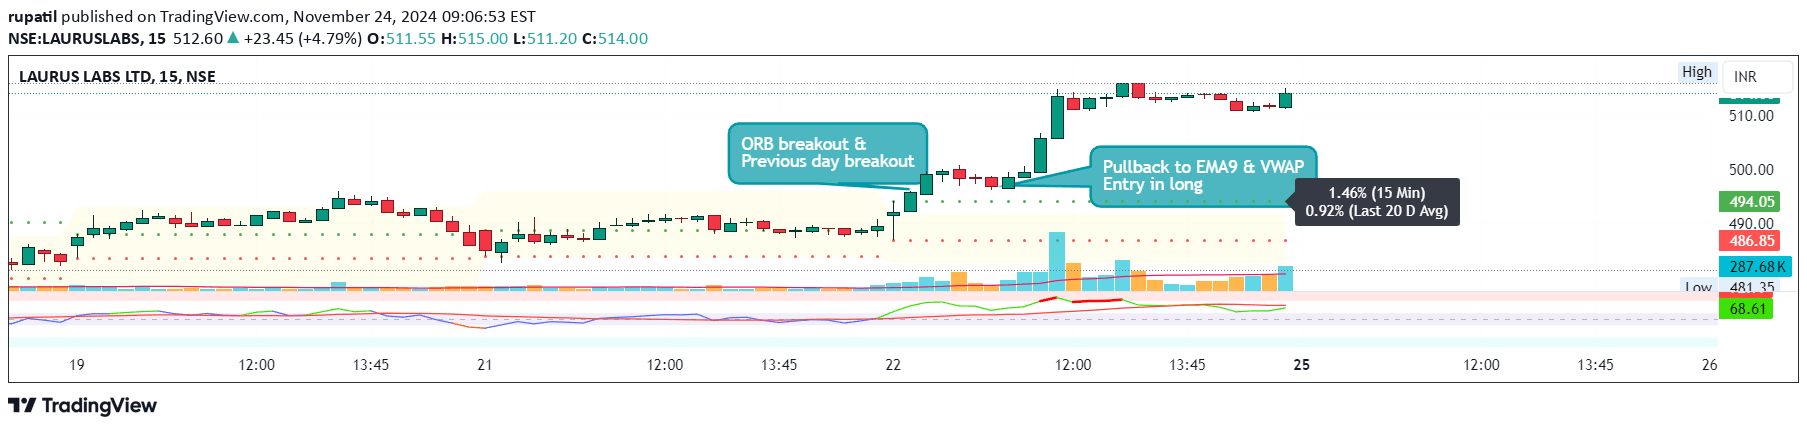
A day trading strategy that analyzes the first candle's breakout to identify potential entry points by examining initial trading range and previous day's price action.
Explore complementary indicator rolesHow it works
The R-DFCB V1.5 strategy focuses on analyzing the first candle of the trading day to identify potential breakout opportunities. It establishes an initial trading range by examining the high and low of the first candle within a selected timeframe, such as 5, 15, or 60 minutes. Traders then look for price movements that exceed this initial range, which could signal a potential trade entry.
The indicator also incorporates previous day and week high/low levels to provide additional context for trading decisions. When the current price breaks above the first candle's high after an upward price gap, it generates a buy signal, while breaking below the first candle's low after a downward price gap triggers a sell signal.
Why it may be useful
The R-DFCB V1.5 strategy provides traders with a structured approach to identifying potential trading opportunities during the early stages of a trading day. By focusing on the first candle's price action and comparing it with previous day's levels, traders can gain insights into potential market momentum and trend direction.
This method helps traders make more informed decisions by providing a systematic framework for entry and exit points. Moreover, the strategy helps traders manage risk by considering market volatility and potential false breakouts. By analyzing the initial trading range and incorporating previous day's high and low levels, traders can develop a more nuanced understanding of market dynamics and potential price movements.
When to explore it
The R-DFCB V1.5 strategy is most effective during periods of clear market trends and when trading instruments exhibit relatively predictable morning price action. It works best in markets with sufficient liquidity and during timeframes that capture the initial market sentiment, such as the first few hours of trading. Traders should be particularly attentive to this strategy during periods of consistent market trends.
However, traders should exercise caution during highly volatile morning sessions and be prepared to adapt the strategy. The indicator is particularly useful when markets show clear directional movements and when there are narrow range bars or observable pullbacks. It is recommended to combine this strategy with other technical analysis tools to confirm signals and improve overall trading decision-making.
Keep exploring
What we’ve verified
Access, alerts and repainting behaviour have not been independently verified for this indicator. Check the creator’s current publication and settings.
General descriptions and classifications are recovered research. Verified details above identify the specific checks we have completed. Check the creator’s current publication for later changes.


