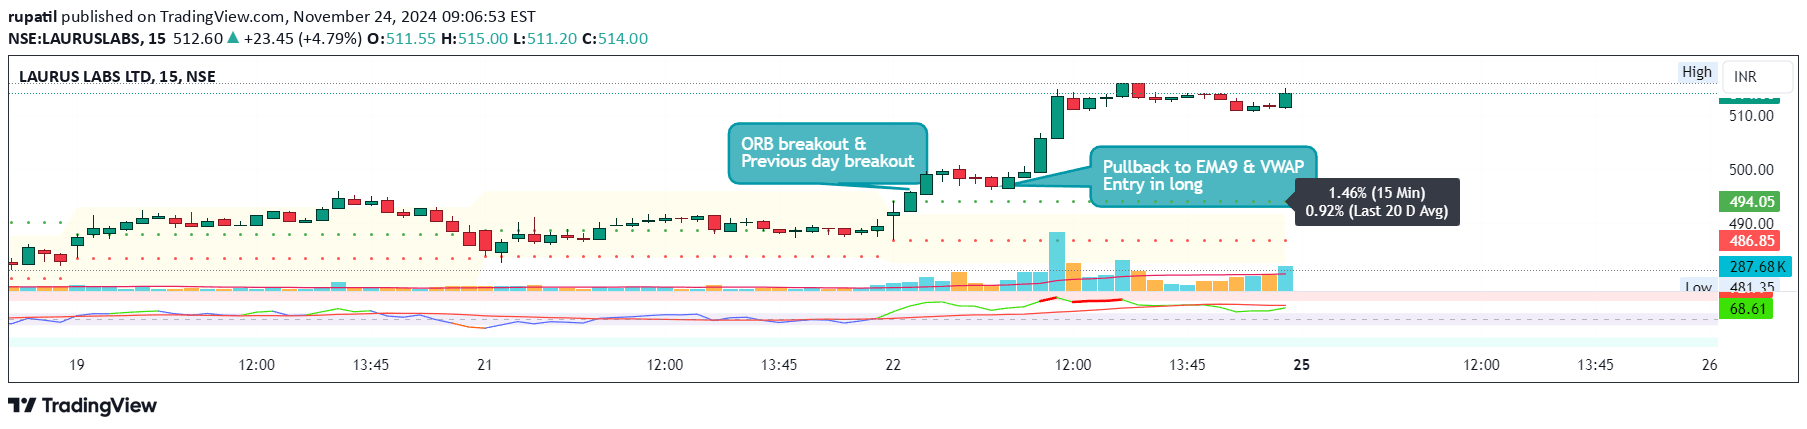
A basic method for identifying initial candle color based on the relationship between closing and opening prices, providing a quick visual representation of price movement direction.
Explore complementary indicator rolesHow it works
The candle color determination process begins by comparing the closing price to the opening price of a specific trading period. When the closing price is higher than or equal to the opening price, the candle is colored green, signaling potential bullish momentum or positive price movement. Conversely, if the closing price falls below the opening price, the candle turns red, indicating potential bearish sentiment or negative price action.
This color-coding method provides traders with an immediate visual interpretation of price dynamics within a given timeframe. By quickly distinguishing between green and red candles, traders can rapidly assess market sentiment and potential trend directions without delving into complex numerical analysis.
Why it may be useful
Candle color serves as a fundamental visual indicator that helps traders quickly understand market sentiment and potential price movements. The simple green and red color scheme allows even novice traders to instantly recognize whether buying or selling pressure dominated during a specific trading period.
This intuitive approach provides an immediate snapshot of market dynamics without requiring extensive technical analysis. Moreover, the color-coding method enables traders to rapidly scan charts and identify potential trend shifts or momentum changes. By observing consecutive candle colors, traders can develop quick insights into market psychology and make more informed trading decisions based on visual price action patterns.
When to explore it
This color-based approach is most effective when analyzing short to medium-term price movements across various financial instruments and timeframes. Traders can utilize this method in volatile markets where quick visual assessment of price action is crucial for making timely trading decisions. It works particularly well when combined with other technical analysis tools to confirm potential trend directions.
The candle color technique is especially useful during high-frequency trading scenarios such as scalping and day trading, where rapid interpretation of market sentiment is essential. Traders can apply this method across different asset classes, including stocks, forex, cryptocurrencies, and commodities, to gain immediate insights into price movement dynamics.
Keep exploring
What we’ve verified
Access, alerts and repainting behaviour have not been independently verified for this indicator. Check the creator’s current publication and settings.
General descriptions and classifications are recovered research. Verified details above identify the specific checks we have completed. Check the creator’s current publication for later changes.