A trend indicator using 21-day EMA and 50-day SMA to highlight bullish zones on daily charts, identifying strong uptrends and potential support levels through color-coded backgrounds.
Explore complementary indicator rolesHow it works
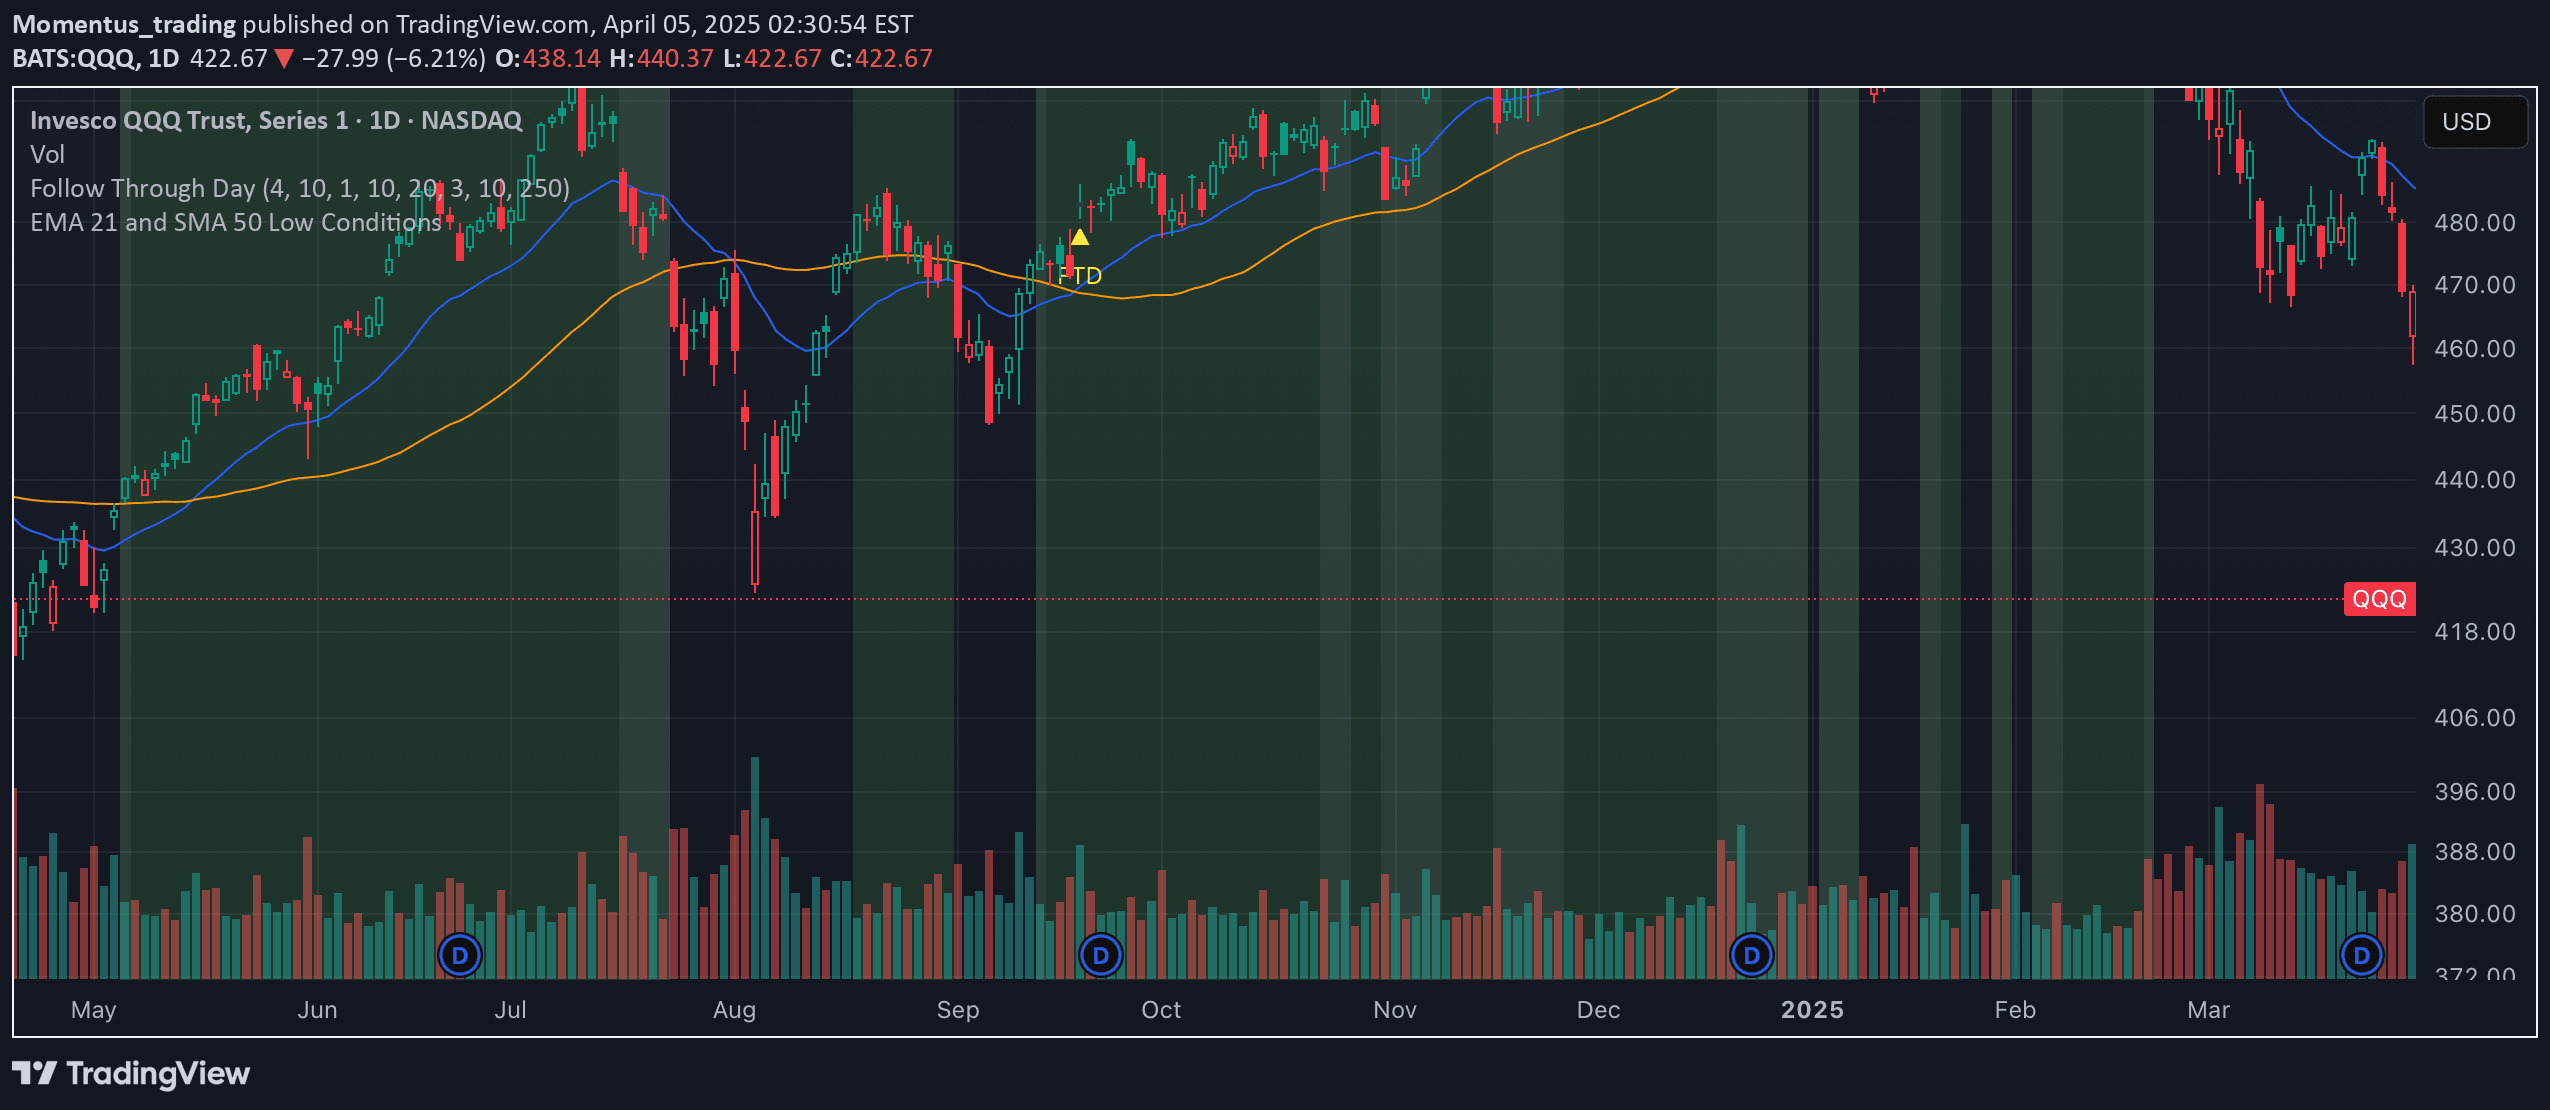
The indicator tracks price movement relative to two moving averages: a 21-day Exponential Moving Average (EMA) and a 50-day Simple Moving Average (SMA). It generates two distinct background colors to signal trend conditions. A green background indicates a strong bullish trend when the price remains above the 21-day EMA for three or more consecutive days.
A yellow background suggests a potential support zone when the price stays above the 50-day SMA after the green zone ends. The indicator plots both moving averages as visual reference lines and dynamically changes background colors based on price action
Why it may be useful
This indicator simplifies trend identification by providing clear visual cues about market momentum and potential support levels. Traders can quickly assess the strength of a bullish trend without complex calculations.
The color-coded system allows for rapid recognition of market conditions, helping traders make faster decisions about entry and exit points. By using both short-term and longer-term moving averages, the indicator offers multiple layers of trend confirmation. It helps traders distinguish between temporary price movements and sustained trend directions
When to explore it
The indicator works best on daily charts with stocks or assets that have consistent trending behavior. It is most effective in markets showing clear directional movement rather than choppy, range-bound conditions. Swing traders will find it particularly useful for identifying sustained uptrends and potential support zones.
The indicator is ideal for traders seeking to confirm trend strength before making trading decisions. It provides additional context during market transitions and can help filter out false signals in volatile markets
Keep exploring
What we’ve verified
Access, alerts and repainting behaviour have not been independently verified for this indicator. Check the creator’s current publication and settings.
General descriptions and classifications are recovered research. Verified details above identify the specific checks we have completed. Check the creator’s current publication for later changes.