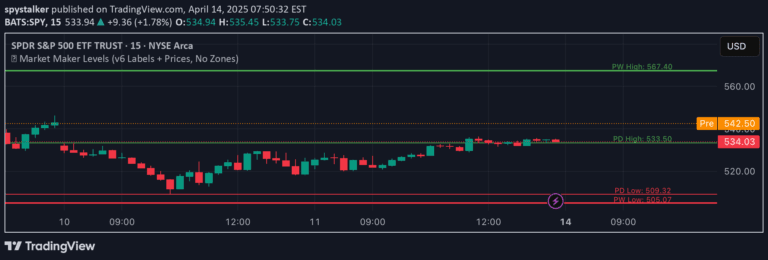
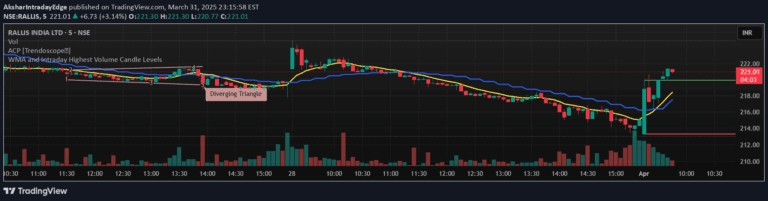
A trading signal that identifies long and short entry points by analyzing candle body size, 9 EMA crossover, and daily pivot levels to generate precise buy and sell signals.
Explore complementary indicator rolesHow it works
The trading signal operates by first analyzing candle characteristics, specifically looking for green (bullish) or red (bearish) candles with a body size of at least 10. It then checks the position of these candles relative to the 9-period Exponential Moving Average (EMA) to determine potential trend momentum.
For a buy signal, the script requires a green candle crossing above the 9 EMA while simultaneously intersecting with one of the daily pivot resistance levels (R1-R5). Conversely, a sell signal is generated when a red candle crosses below the 9 EMA and touches one of the daily pivot support levels (S1-S5).
Why it may be useful
This trading signal provides traders with a structured approach to identifying potential entry points by combining multiple technical analysis elements. By integrating candle body size, moving average dynamics, and pivot levels, the indicator offers a more comprehensive view of market conditions than single-metric strategies.
The signal's strength lies in its ability to capture momentum shifts and potential trend reversals with precise entry criteria. Traders can use this method to make more informed decisions, reducing emotional trading and providing a systematic approach to market analysis.
When to explore it
The trading signal is most effective in markets with clear trending characteristics and moderate volatility. It performs best in timeframes that allow for quick identification of momentum changes, such as intraday and short-term trading scenarios where pivot levels and EMA interactions are more pronounced.
Traders should be cautious during periods of extreme market volatility or during news events that can cause rapid and unpredictable price movements. The signal is particularly useful in liquid markets with consistent price action, such as major forex pairs, stock indices, and actively traded commodities.
Keep exploring
What we’ve verified
Access, alerts and repainting behaviour have not been independently verified for this indicator. Check the creator’s current publication and settings.
General descriptions and classifications are recovered research. Verified details above identify the specific checks we have completed. Check the creator’s current publication for later changes.