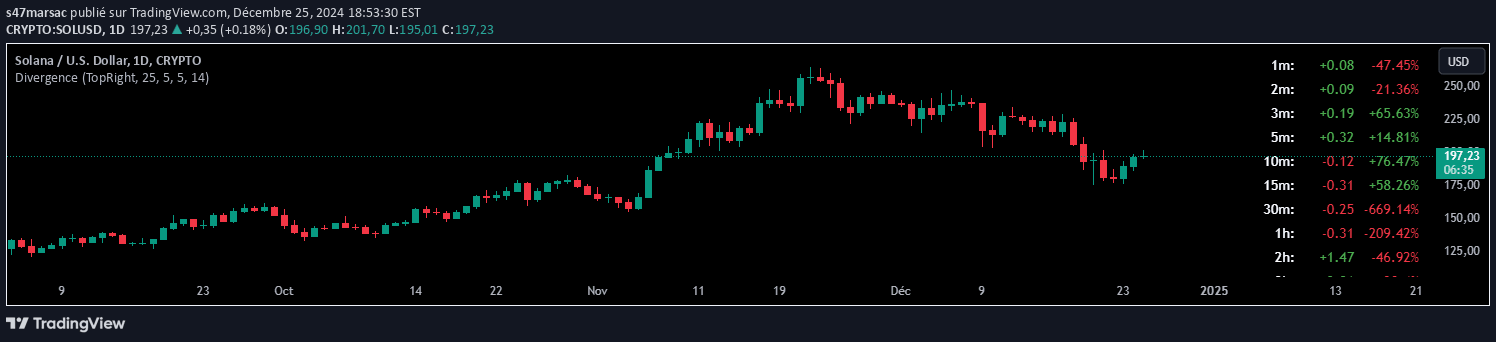
A technical indicator that tracks the number of days since an asset's last all-time high, helping traders understand market correction and consolidation phases.
Explore complementary indicator rolesHow it works
The indicator continuously calculates and displays the time elapsed since an asset last reached its peak price point. It tracks the highest historical price and measures the duration from that point, resetting only when a new all-time high is established.
By maintaining a running count of days, traders can visually see how long an asset has been trading below its previous peak. This provides insights into market sentiment, potential trend exhaustion, and the depth of current price corrections.
Why it may be useful
Understanding the duration of price corrections helps traders assess market psychology and potential trend reversals. It provides a clear, quantitative measure of how long an asset has been struggling to regain its previous highest value.
This metric can signal market fatigue, potential bottoming patterns, or the start of a new bullish momentum. Traders can use this information to make more informed decisions about entry points, trend strength, and potential future price movements.
When to explore it
The indicator is most useful during periods of market consolidation or when an asset is experiencing prolonged corrections after a significant peak. It can be particularly valuable in identifying potential trend reversals or assessing market sentiment.
Traders should combine this indicator with other technical analysis tools to confirm signals and develop more comprehensive trading strategies. It works best when used alongside volume indicators, momentum oscillators, and trend-following metrics.
Keep exploring
What we’ve verified
Access, alerts and repainting behaviour have not been independently verified for this indicator. Check the creator’s current publication and settings.
General descriptions and classifications are recovered research. Verified details above identify the specific checks we have completed. Check the creator’s current publication for later changes.