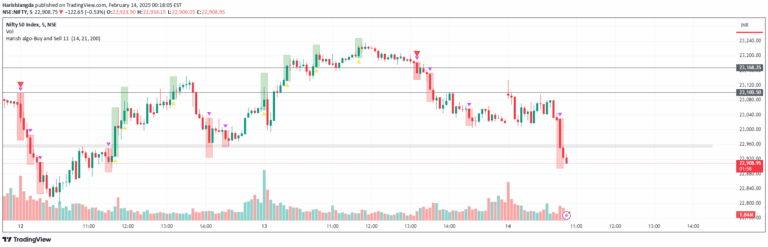
A custom NYSE TICK chart indicator with horizontal levels, color fills, and dynamic EMA that helps traders visualize market breadth and sentiment through key technical zones.
Explore complementary indicator rolesHow it works
The NYSE TICK chart indicator operates by plotting multiple horizontal lines at strategic price levels like 1300, -1300, 1000, -1000, and 850, -850 to represent market sentiment zones. These lines are color-coded and help traders quickly identify extreme bullish and bearish conditions in market breadth.
An exponential moving average (EMA) is calculated and dynamically colored based on its slope, with white indicating an upward trend and magenta signaling a downward trend. The indicator also includes color fills between specific levels to further emphasize market sentiment and provide visual cues about potential market movement.
Why it may be useful
This NYSE TICK chart indicator is crucial for traders seeking to understand market breadth and sentiment in real-time, providing a comprehensive visual representation of market dynamics. By offering multiple reference points and color-coded signals, traders can quickly assess the overall market mood and potential directional shifts.
The combination of horizontal levels, color fills, and a dynamic EMA allows traders to make more informed decisions by providing context beyond simple price action. It helps identify potential market turning points, assess trend strength, and recognize when market sentiment might be reaching extreme conditions.
When to explore it
The NYSE TICK chart indicator is most effective during volatile market conditions when traders need rapid insights into market sentiment and breadth. It works particularly well during intraday trading sessions, where quick assessment of market momentum can lead to more strategic entry and exit decisions.
Traders should use this indicator when looking to confirm trend strength, identify potential reversal zones, and gain a deeper understanding of market internals. It is especially useful for short-term traders who need to make quick decisions based on market sentiment and breadth indicators.
Keep exploring
What we’ve verified
Access, alerts and repainting behaviour have not been independently verified for this indicator. Check the creator’s current publication and settings.
General descriptions and classifications are recovered research. Verified details above identify the specific checks we have completed. Check the creator’s current publication for later changes.