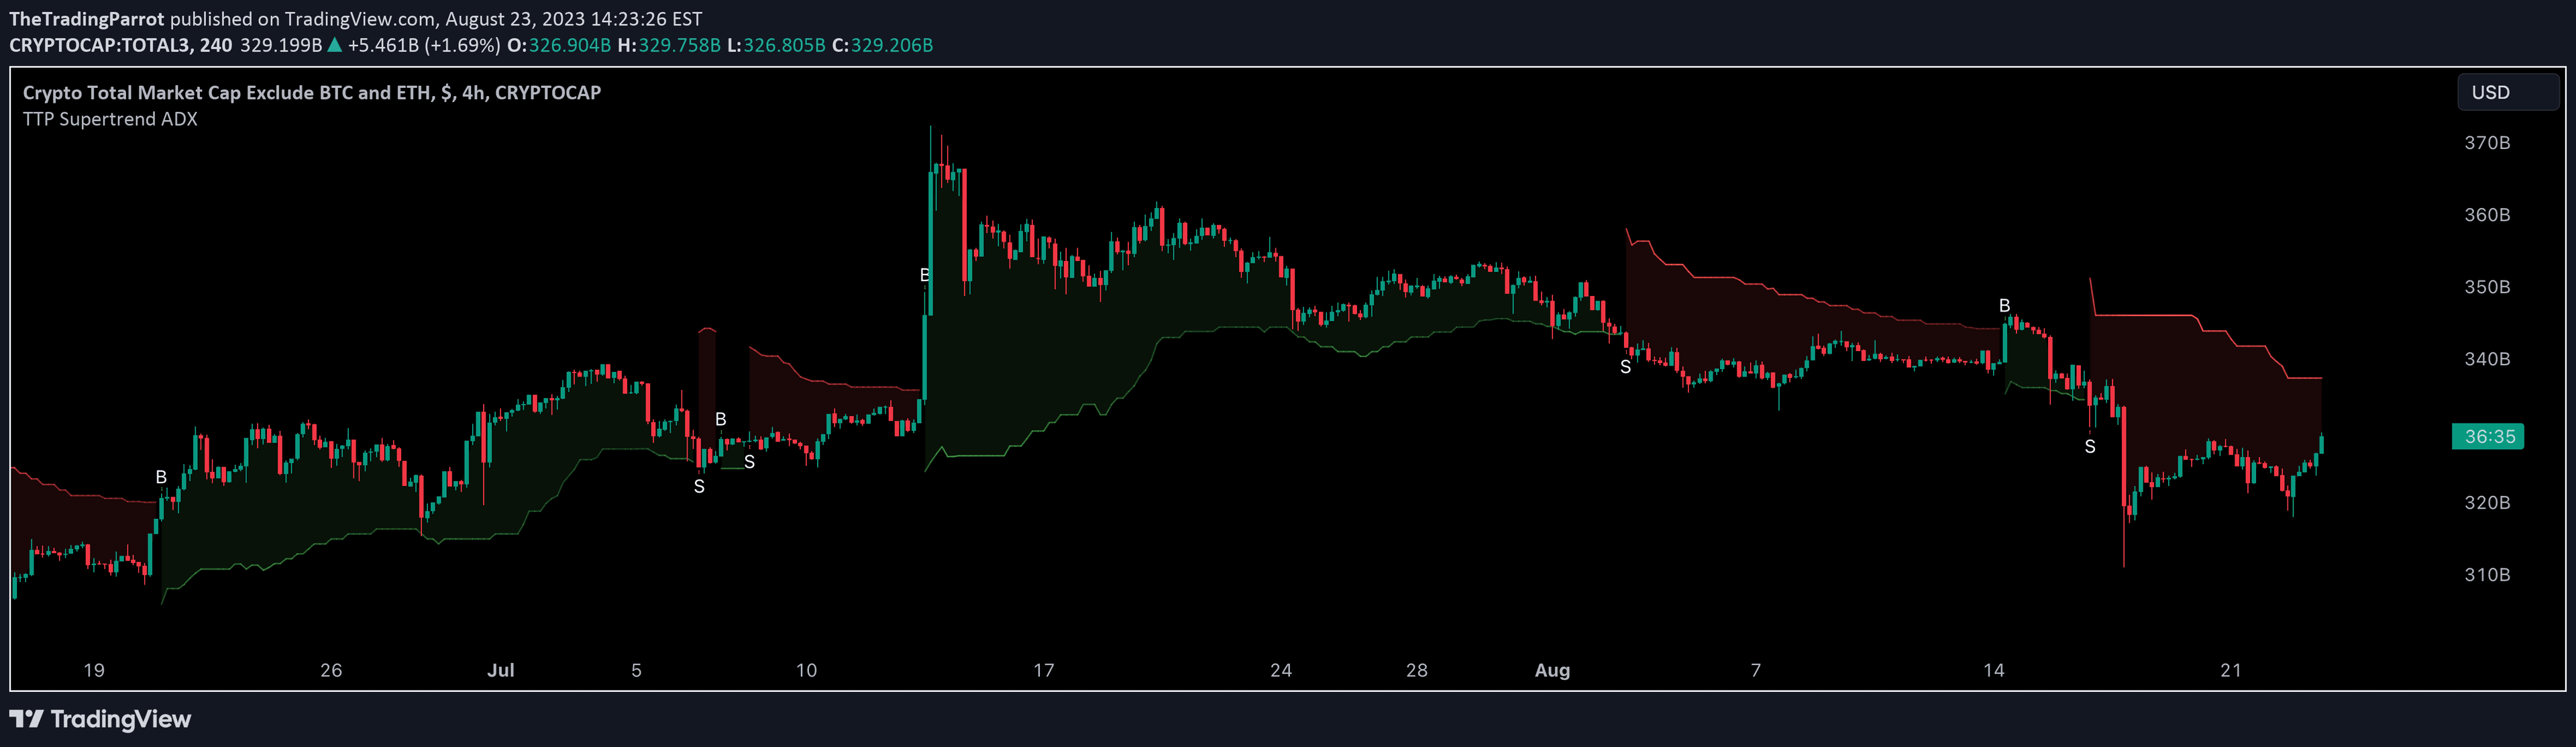
A trading indicator that identifies strong price movements by analyzing consecutive candles, body size, and market volatility to detect potential trend shifts.
Explore complementary indicator rolesHow it works
The Displacement indicator analyzes price action by examining candle characteristics and market momentum. It focuses on identifying strong directional movements through specific criteria like body size and consecutive candle patterns.
By combining candlestick analysis with Average True Range (ATR), the indicator filters out minor price fluctuations and highlights significant market shifts. When predefined requirements are met, a triangle is plotted above or below the price bar to signal a potential trend change.
Why it may be useful
Displacement helps traders recognize powerful market movements that might indicate emerging trends or sentiment shifts. By focusing on substantial price actions, traders can gain insights into potential entry and exit points with greater confidence.
The indicator's comprehensive approach allows traders to filter out noise and concentrate on meaningful market movements. Its ability to combine multiple analytical techniques provides a more robust method of identifying potential trading opportunities across different market conditions.
When to explore it
The Displacement indicator works best during periods of market trending or when transitioning between consolidation and directional movement. It is particularly effective in markets experiencing clear momentum with consistent candle body sizes and directional strength.
Traders should apply this indicator in markets with sufficient volatility and clear directional bias. It is most reliable when used in conjunction with other technical analysis tools to confirm potential trade signals and reduce false positive interpretations.
Keep exploring
What we’ve verified
Access, alerts and repainting behaviour have not been independently verified for this indicator. Check the creator’s current publication and settings.
General descriptions and classifications are recovered research. Verified details above identify the specific checks we have completed. Check the creator’s current publication for later changes.