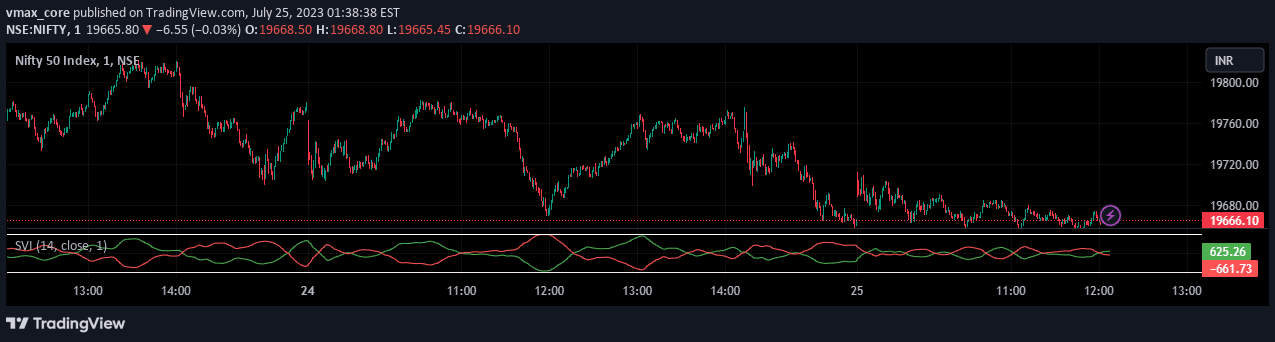
A versatile indicator combining Directional Movement Index and Moving Averages to identify market trends, momentum, and consolidation phases with color-coded visual signals.
Explore complementary indicator rolesHow it works
The Consolidation Indicator leverages the Directional Movement Index (DMI) to assess trend strength and direction by analyzing price movements. It calculates +DI and -DI lines that represent bullish and bearish momentum, respectively, allowing traders to understand market dynamics.
Simultaneously, the indicator incorporates Moving Averages to confirm trend signals and provide additional trend validation. By combining these two powerful analytical tools, the indicator creates color-coded boxes that visually represent market conditions, making it easy for traders to quickly interpret potential trading opportunities.
Why it may be useful
This indicator is crucial for traders seeking a comprehensive market analysis tool that goes beyond simple trend identification. By integrating DMI and Moving Averages, it provides a more nuanced view of market behavior, helping traders make more informed decisions about potential entry and exit points.
The visual representation through color-coded boxes allows traders to quickly understand market conditions, reducing the complexity of trend analysis. This approach helps traders identify not just trend direction, but also momentum and potential consolidation phases, which are critical for developing effective trading strategies.
When to explore it
The Consolidation Indicator is most effective in markets with clear trending and ranging conditions, making it valuable across various asset classes and timeframes. Traders can utilize this tool during periods of both strong directional movement and market consolidation, adapting their strategies accordingly.
It is particularly useful when traders want to confirm trend strength, identify potential trend reversals, and understand market momentum. The indicator's flexibility in customizing parameters like ADX smoothing, DI length, and moving average type allows traders to fine-tune the signal to match their specific trading style and market conditions.
Keep exploring
What we’ve verified
Access, alerts and repainting behaviour have not been independently verified for this indicator. Check the creator’s current publication and settings.
General descriptions and classifications are recovered research. Verified details above identify the specific checks we have completed. Check the creator’s current publication for later changes.