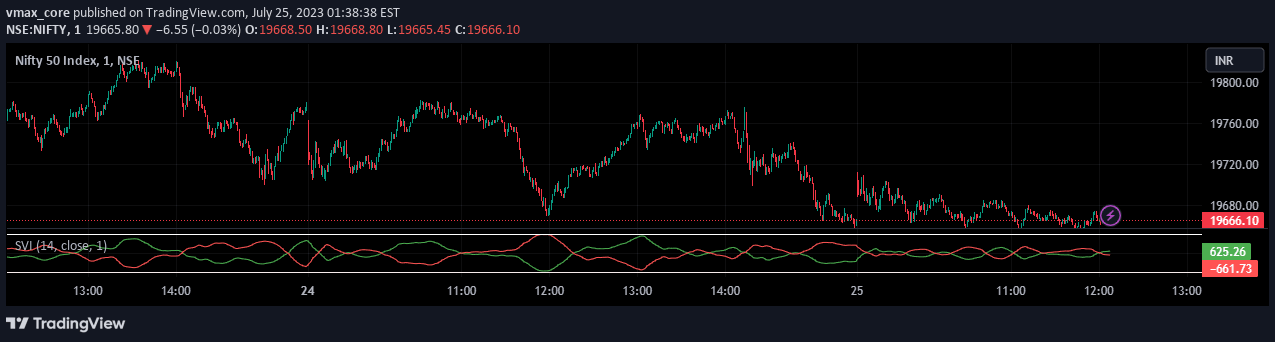
The Smoothed Vortex Indicator (SVI) enhances trend analysis by combining the original Vortex Indicator with Hull Moving Average for improved trend strength and reversal identification.
Explore complementary indicator rolesHow it works
The Smoothed Vortex Indicator (SVI) builds upon the original Vortex Indicator by calculating positive (VI+) and negative (VI-) directional movement lines. It uses True Range (TR), Plus Directional Movement (PDM), and Minus Directional Movement (MDM) over a typical 14-period timeframe to generate these lines.
What distinguishes the SVI is its application of the Hull Moving Average (HMA) to smooth these lines, providing a more refined trend representation. The indicator further introduces a customizable Weighting Factor, allowing traders to fine-tune the smoothing effect and enhance the precision of trend identification and potential market reversal signals.
Why it may be useful
The SVI offers traders a more sophisticated approach to trend analysis by combining multiple analytical techniques into a single, powerful indicator. By integrating the Vortex Indicator's directional movement principles with the Hull Moving Average's smoothing capabilities, it provides a more nuanced view of market trends and potential reversals.
This enhanced methodology helps traders reduce market noise and improve their ability to make informed trading decisions. The customizable Weighting Factor adds an extra layer of flexibility, enabling traders to adapt the indicator to different market conditions and personal trading strategies.
When to explore it
The Smoothed Vortex Indicator is most effective in markets with clear directional movements and moderate volatility. It performs exceptionally well in trending markets where identifying trend strength and potential reversal points is crucial for successful trading strategies.
Traders should consider using the SVI across various timeframes, from short-term scalping to longer-term swing trading. It is particularly useful when combined with other technical indicators to confirm trend signals and provide additional insight into market dynamics.
Keep exploring
What we’ve verified
Access, alerts and repainting behaviour have not been independently verified for this indicator. Check the creator’s current publication and settings.
General descriptions and classifications are recovered research. Verified details above identify the specific checks we have completed. Check the creator’s current publication for later changes.