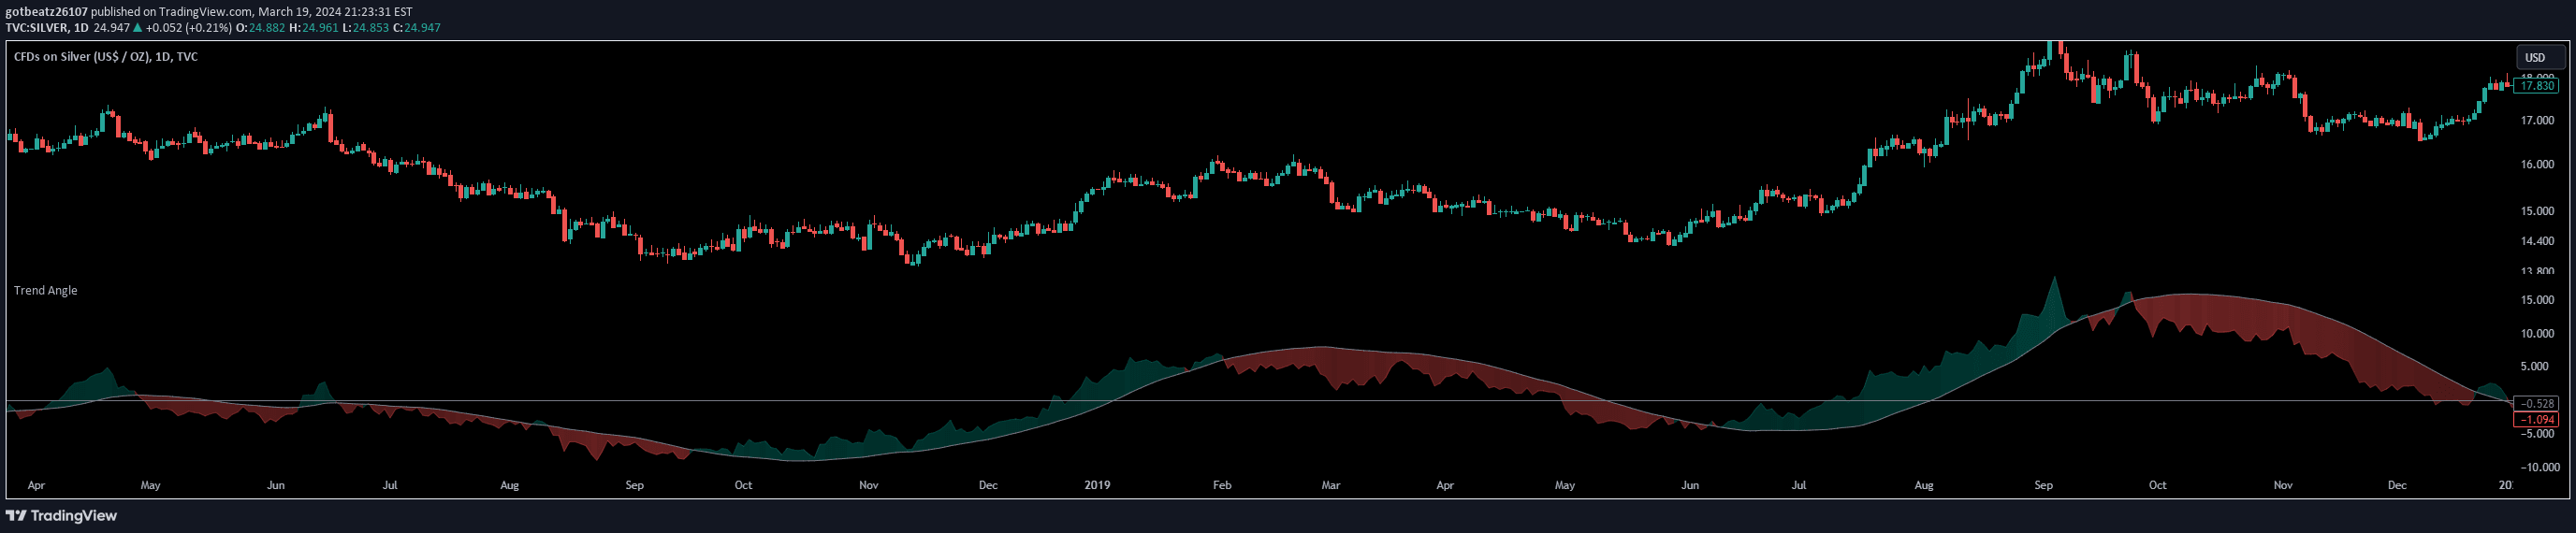
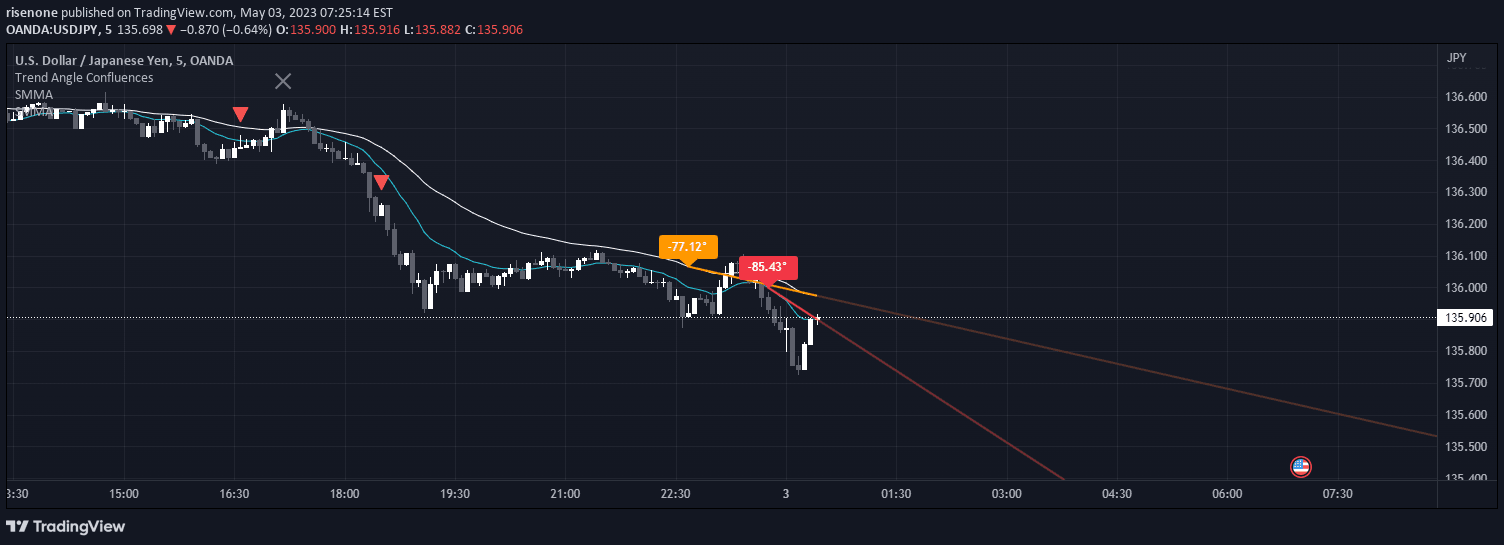
The Trend Angle Indicator measures trend strength by calculating the angle of a Simple Moving Average and smoothing it with an Exponential Moving Average for momentum insights.
Explore complementary indicator rolesHow it works
The Trend Angle Indicator operates by first calculating a Simple Moving Average (SMA) of the close price over a specified length. It then determines the trend's height by subtracting the current SMA value from the SMA value at a prior period, which reveals the trend's magnitude.
Using the arctangent function, the indicator converts this height difference into an angle in degrees. An Exponential Moving Average is then applied to smooth the angle values, creating a more refined representation of the trend's direction and intensity.
Why it may be useful
The Trend Angle Indicator provides traders with a sophisticated method of understanding market momentum by translating price movements into an easily interpretable angular measurement. By visualizing trend strength through color-coded plots and zero-line crossings, traders can quickly assess market sentiment and potential directional changes.
This approach offers a more nuanced view of trend dynamics compared to traditional trend indicators, allowing traders to detect subtle shifts in market psychology and make more informed trading decisions based on the trend's angle and smoothed trajectory.
When to explore it
The Trend Angle Indicator is most effective in markets with clear directional movements, such as trending stocks, commodities, or forex pairs. It performs exceptionally well in identifying early trend reversals and measuring the strength of emerging market movements across different timeframes.
Traders should utilize this indicator in conjunction with other technical analysis tools to confirm signals and validate potential entry or exit points. It is particularly valuable during periods of market transition, helping traders distinguish between temporary fluctuations and significant trend changes.
Keep exploring
What we’ve verified
Access, alerts and repainting behaviour have not been independently verified for this indicator. Check the creator’s current publication and settings.
General descriptions and classifications are recovered research. Verified details above identify the specific checks we have completed. Check the creator’s current publication for later changes.