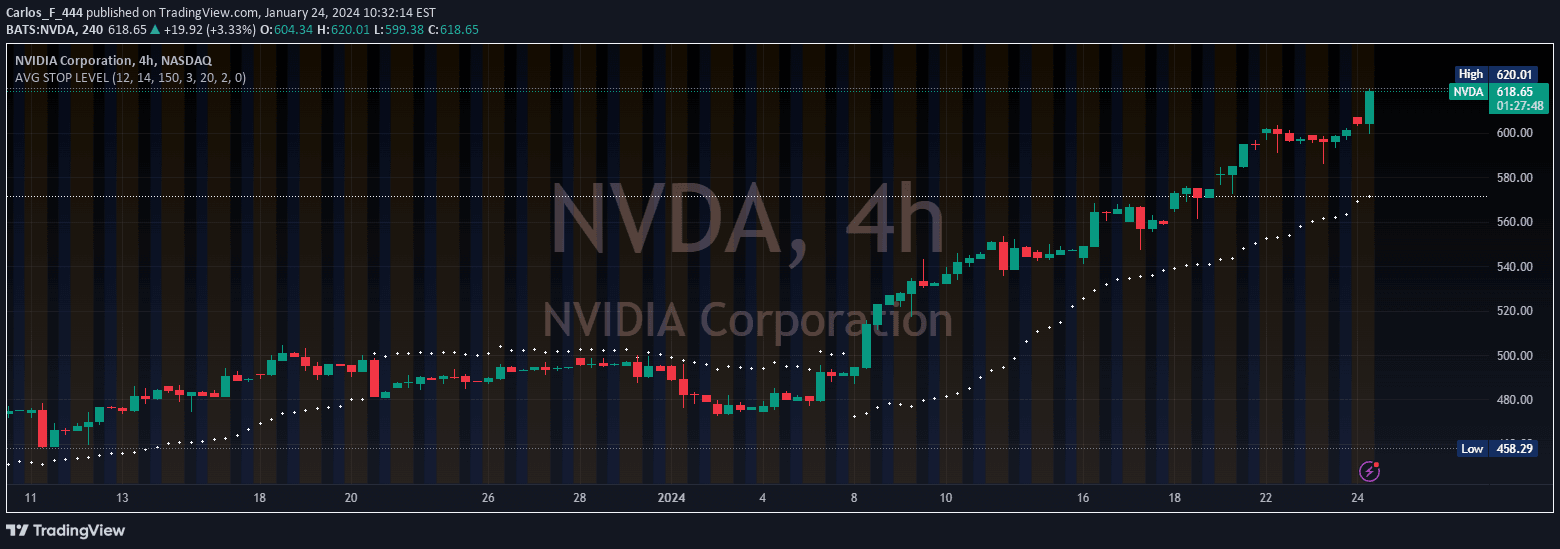
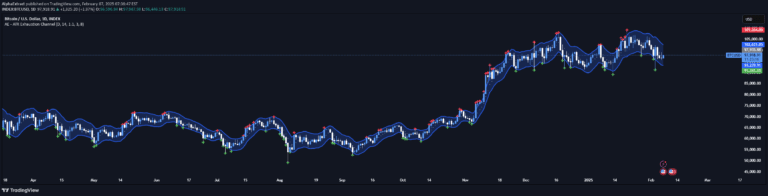
A comprehensive technical analysis tool combining Directional Movement Index, Bollinger Bands, and Moving Averages to identify market trends, strength, and potential reversal points.
Explore complementary indicator rolesHow it works
The Directional Movement Index (DMI) with Bollinger Bands and Moving Averages operates by analyzing market trend strength and momentum through multiple technical indicators. It calculates directional movement using +DI and -DI lines, which help identify the direction and intensity of price trends.
Bollinger Bands are then applied to these lines to measure volatility, while Moving Averages provide additional trend confirmation. The system generates color-coded signals, with green boxes indicating potential bullish opportunities and red boxes suggesting bearish scenarios, helping traders make more informed decisions.
Why it may be useful
This multi-layered technical analysis tool provides traders with a comprehensive view of market dynamics by combining trend, momentum, and volatility indicators. By integrating different analytical components, it offers a more nuanced understanding of potential market movements, reducing the risk of making trading decisions based on limited information.
The indicator's ability to generate clear, color-coded signals makes complex technical analysis more accessible to traders of varying skill levels. Its flexible customization options allow traders to adapt the tool to different market conditions and personal trading strategies, enhancing its utility across various financial instruments and timeframes.
When to explore it
The DMI with Bollinger Bands and Moving Averages is most effective in markets with clear trending characteristics, where price movements show consistent directional momentum. It works particularly well in liquid markets with sufficient trading volume, such as major forex pairs, stock indices, and large-cap stocks.
Traders should consider using this indicator during periods of moderate to high market volatility, where trend strength and potential reversals are more likely to occur. It is especially valuable when combined with other confirmation tools, helping traders identify high-probability entry and exit points across different trading timeframes.
Keep exploring
What we’ve verified
Access, alerts and repainting behaviour have not been independently verified for this indicator. Check the creator’s current publication and settings.
General descriptions and classifications are recovered research. Verified details above identify the specific checks we have completed. Check the creator’s current publication for later changes.