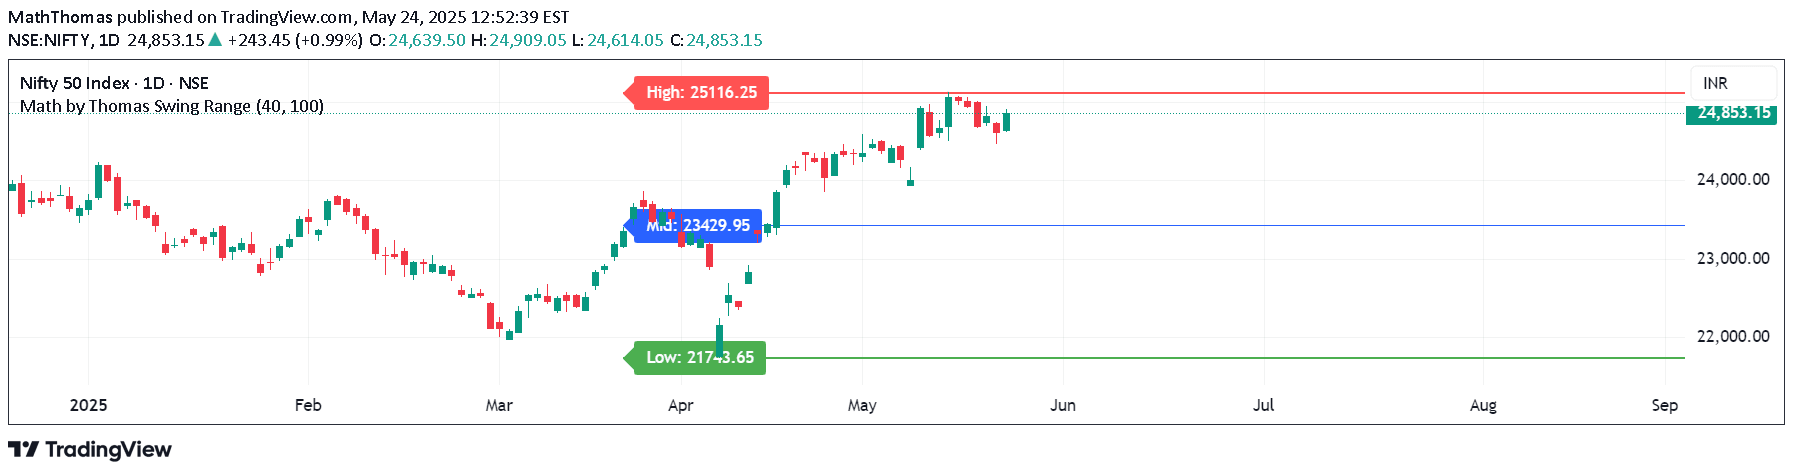
A Dow Theory-based waveform analyzer that identifies swing lows and highs to determine market trend direction, helping traders understand price wave progression and potential trend changes.
Explore complementary indicator rolesHow it works
The Dow Waveform Analyzer uses Pine Script's pivotlow and pivothigh functions to automatically identify wave lows and wave highs in price movements. It tracks these pivot points by connecting them alternately, creating a visual representation of price waves that shows how stocks move in non-linear patterns.
When consecutive wave lows or highs occur, the indicator selects the lower low or higher high for drawing the waveform. By monitoring the progression of these swing points, the analyzer can detect changes in trend direction, helping traders understand whether the market is in an uptrend, downtrend, or moving sideways.
Why it may be useful
The Dow Waveform Analyzer provides traders with a systematic approach to understanding market trends beyond simple high and low updates. By breaking down price movements into waves, traders can gain deeper insights into market dynamics and potential trend reversals that might be missed with traditional analysis methods.
This indicator offers a more nuanced view of market behavior, allowing traders to make more informed decisions about trade entries, exits, and overall strategy. By visualizing wave progressions, traders can better anticipate potential trend changes and develop more precise trading strategies.
When to explore it
The Dow Waveform Analyzer is most effective in markets with clear trending or ranging characteristics, where price movements create distinct wave patterns. It works well across multiple timeframes, from short-term scalping to longer-term swing trading, making it versatile for different trading styles and market conditions.
Traders should use this indicator in conjunction with other technical analysis tools to confirm trend signals and potential trade setups. It is particularly useful for identifying trend starts, continuations, and reversals, helping traders set more strategic stop orders and filter out potentially unfavorable trading conditions.
Keep exploring
What we’ve verified
Access, alerts and repainting behaviour have not been independently verified for this indicator. Check the creator’s current publication and settings.
General descriptions and classifications are recovered research. Verified details above identify the specific checks we have completed. Check the creator’s current publication for later changes.