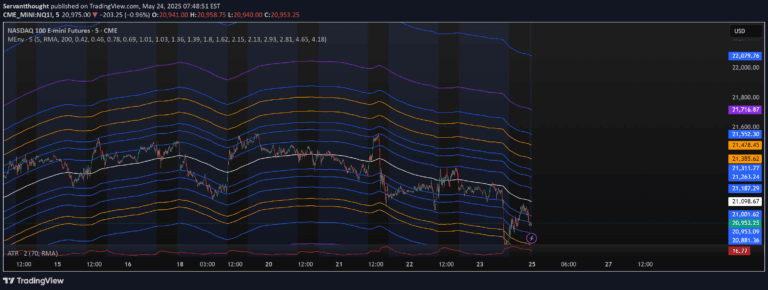
Drummond Geometry uses PL Dot and Envelope Top/Bottom to analyze market energy, trend direction, and key support/resistance levels for potential trade entries.
Explore complementary indicator rolesHow it works
The Drummond Geometry method calculates the PL Dot by averaging the high, low, and close of the last three bars, creating a dynamic trend indicator that reflects short-term market energy. This PL Dot acts as a magnetic point that prices tend to return to, showing trend direction through its slope and movement.
Simultaneously, the Envelope Top and Bottom are created by averaging the highs and lows of three previous periods, establishing dynamic support and resistance zones. These envelopes help traders visualize price cycles and potential market turning points by highlighting key levels where price momentum may change or continue.
Why it may be useful
Drummond Geometry provides traders with a comprehensive view of market dynamics by combining trend analysis and key price levels in a single approach. It offers insights into market energy, helping traders understand potential price movements and identify high-probability trading opportunities across different market conditions.
The method's strength lies in its adaptability and predictive power, allowing traders to interpret market flow more effectively. By tracking the PL Dot and Envelope boundaries, traders can gain a deeper understanding of market trends, potential reversals, and continuation patterns.
When to explore it
Drummond Geometry is most effective in markets with clear trending or ranging characteristics, making it versatile across different asset classes and timeframes. Traders can apply this method when seeking to identify short-term trend changes, potential reversal points, or continuation signals in their trading strategy.
The technique works particularly well in markets with moderate volatility, where price movements are not extremely erratic. It is especially useful for traders looking to combine trend analysis with support and resistance levels, providing a holistic approach to market interpretation and trade decision-making.
Keep exploring
What we’ve verified
Access, alerts and repainting behaviour have not been independently verified for this indicator. Check the creator’s current publication and settings.
General descriptions and classifications are recovered research. Verified details above identify the specific checks we have completed. Check the creator’s current publication for later changes.