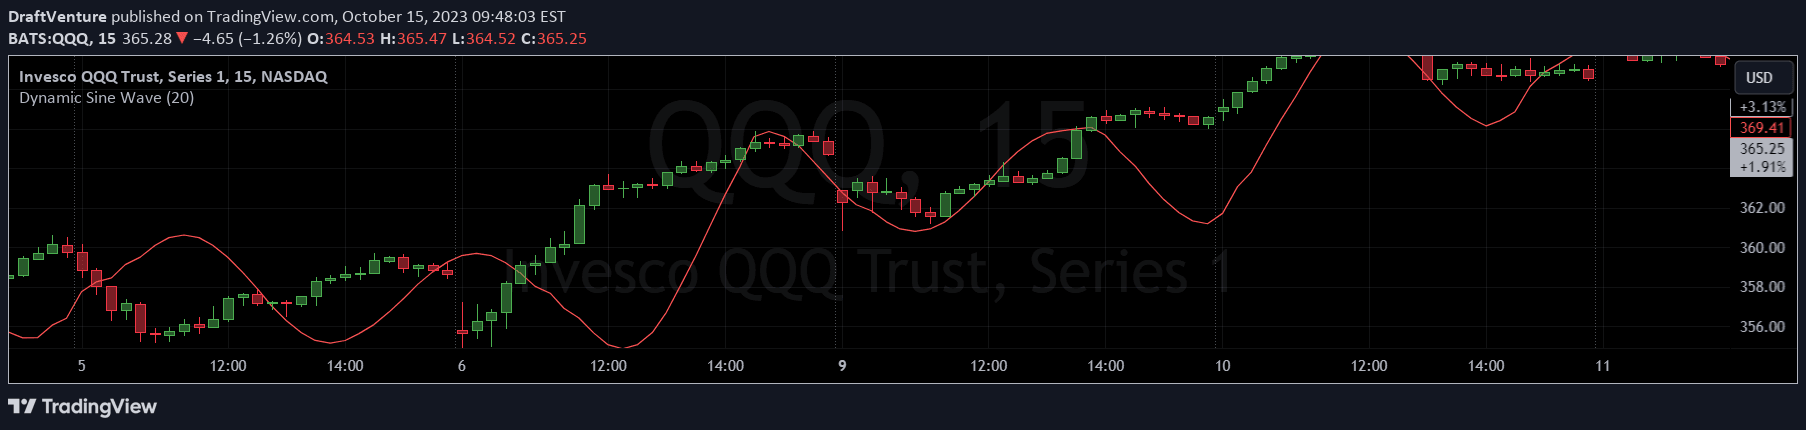
A mathematical sine wave indicator that captures cyclic price movements by tracking market oscillations between highest and lowest points, revealing dynamic market trends and potential reversals.
Explore complementary indicator rolesHow it works
The Dynamic Sine Wave calculates a periodic mathematical function that represents price movements by mapping the highest and lowest price points over a specified timeframe. It dynamically adjusts its amplitude and frequency based on current market volatility, creating a visual representation of price oscillations that tracks how prices move in cyclical patterns.
By transforming price data into a sine wave, the indicator maps out the repetitive nature of market trends, showing how prices naturally fluctuate between peak and trough levels. The wave's shape provides traders with insights into potential trend reversals, momentum shifts, and underlying market rhythms that might not be immediately apparent through traditional price charts.
Why it may be useful
The Dynamic Sine Wave offers traders a unique mathematical perspective on market behavior by translating complex price movements into an intuitive, periodic representation. Unlike linear indicators, this approach captures the inherent cyclical nature of financial markets, revealing underlying patterns that can help predict potential trend changes and market sentiment.
By presenting price action as a continuous wave, traders can more easily identify recurring market rhythms, potential reversal points, and momentum shifts. This approach provides a more holistic view of market dynamics, enabling traders to make more informed decisions based on the natural ebb and flow of price movements.
When to explore it
The Dynamic Sine Wave is most effective in markets with clear cyclical patterns, such as forex, commodities, and certain stock indices that demonstrate regular oscillatory behavior. Traders can leverage this indicator during periods of moderate volatility where price movements show discernible wave-like characteristics, helping to identify potential entry and exit points.
This indicator works particularly well when combined with other technical analysis tools, providing complementary insights into market trends. It is especially valuable for traders seeking to understand underlying market rhythms and anticipate potential trend reversals before they become obvious through traditional price action analysis.
Keep exploring
What we’ve verified
Access, alerts and repainting behaviour have not been independently verified for this indicator. Check the creator’s current publication and settings.
General descriptions and classifications are recovered research. Verified details above identify the specific checks we have completed. Check the creator’s current publication for later changes.