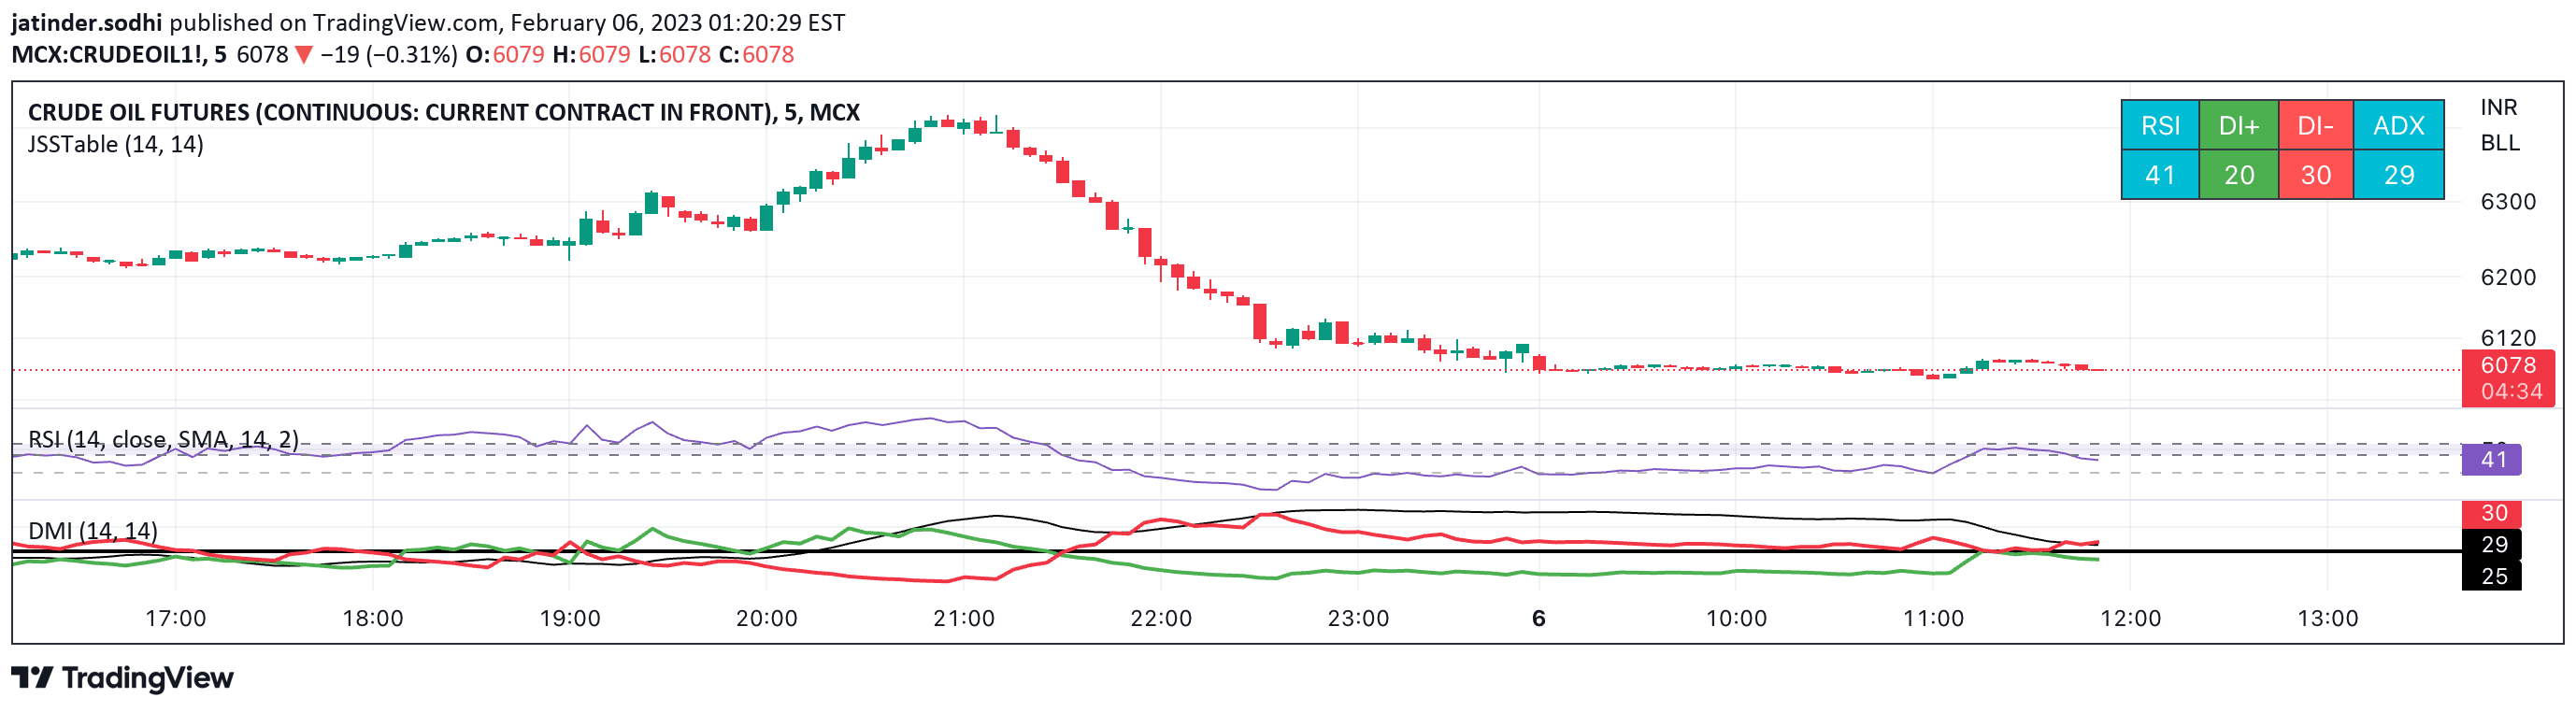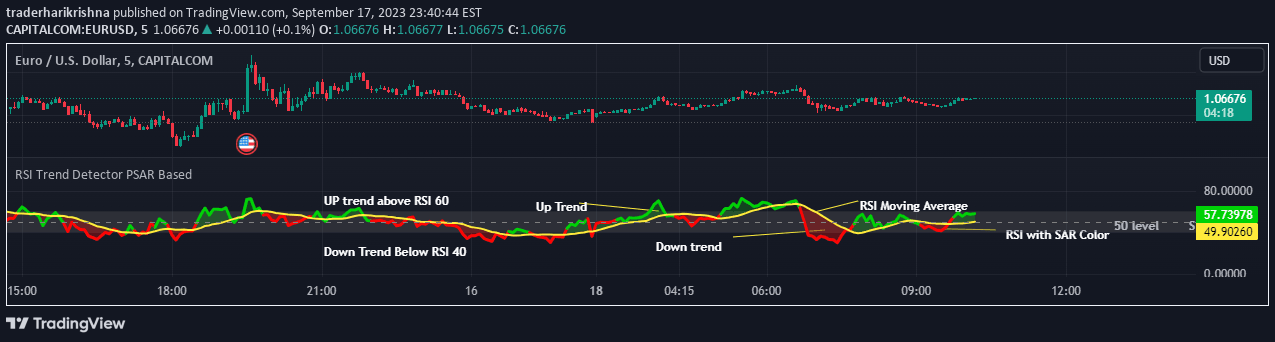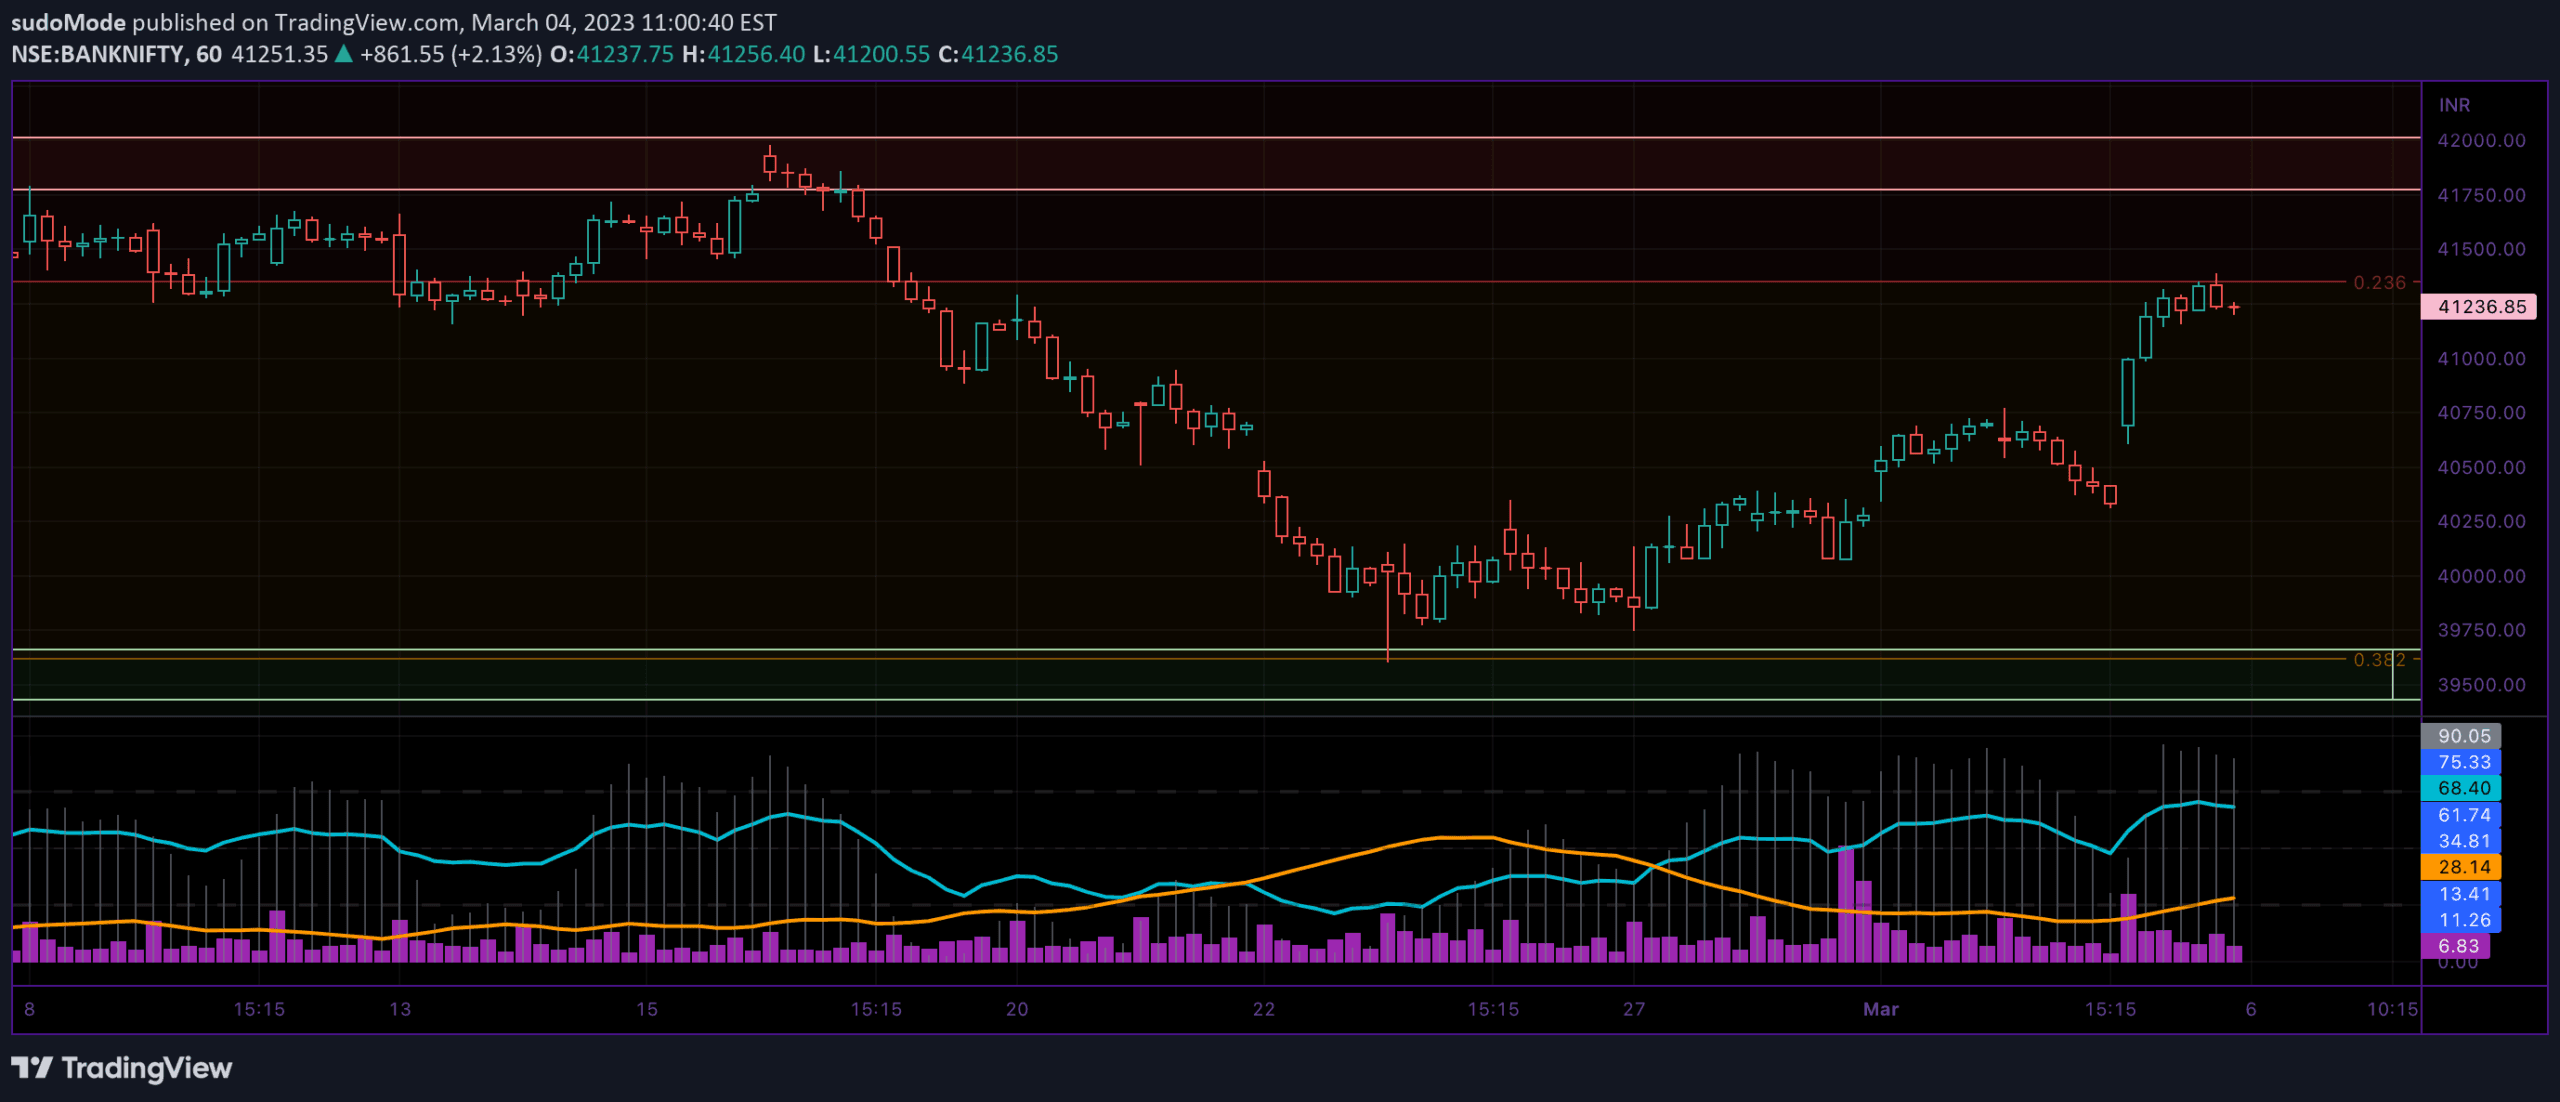
Dynamo combines RSI, Stochastic, and ADX to provide a comprehensive view of price movement, strength, and momentum across multiple market dimensions.
Explore complementary indicator rolesHow it works
Dynamo integrates three technical analysis indicators to analyze price dynamics comprehensively. The Relative Strength Index (RSI) measures price change velocity by comparing bullish and bearish strength, generating values between 0-100 that indicate market momentum.
Simultaneously, the Stochastic indicator measures market momentum by comparing recent closing prices to price ranges, while the Average Directional Index (ADX) quantifies trend strength by analyzing directional movement indices. These indicators work together to provide a multi-dimensional view of market behavior.
Why it may be useful
Traders benefit from Dynamo's holistic approach to market analysis by gaining insights that a single indicator cannot provide. By combining RSI, Stochastic, and ADX, traders can cross-validate signals and reduce the likelihood of false interpretations, especially in volatile market conditions.
The tool helps traders make more informed decisions by offering a nuanced understanding of price movement, trend strength, and potential reversals. Its ability to integrate multiple perspectives allows for a more robust and comprehensive market assessment.
When to explore it
Dynamo is most effective when traders need a comprehensive view of market dynamics across different timeframes and trading styles. It is particularly useful in markets experiencing significant price movements or when traders want to confirm trend strength and potential reversals.
The indicator works best when used as a complementary tool alongside other technical analysis methods, helping traders validate signals and make more confident trading decisions. Its versatility makes it suitable for various trading strategies, from short-term scalping to longer-term swing trading.
Keep exploring
What we’ve verified
Access, alerts and repainting behaviour have not been independently verified for this indicator. Check the creator’s current publication and settings.
General descriptions and classifications are recovered research. Verified details above identify the specific checks we have completed. Check the creator’s current publication for later changes.