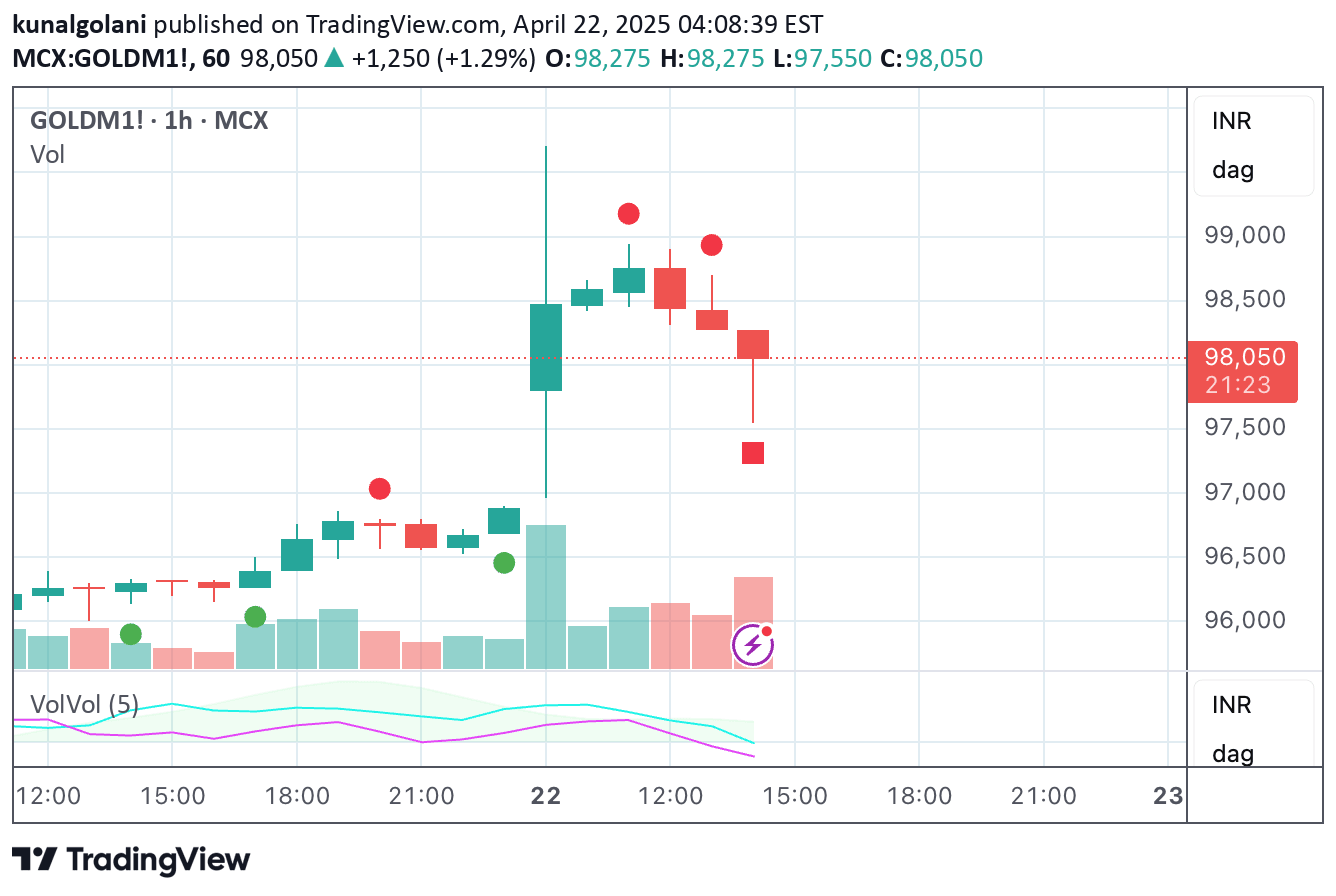
An advanced volatility indicator using EGARCH model to measure market risk by analyzing price fluctuations, standardizing returns, and providing dynamic volatility insights across different market conditions.
Explore complementary indicator rolesHow it works
The EGARCH Volatility Estimator operates by calculating log-returns and applying a sophisticated mathematical model that captures both symmetric and asymmetric market volatility dynamics. It uses a complex formula that incorporates multiple parameters like omega (baseline volatility), alpha (shock sensitivity), gamma (asymmetric effects), and beta (historical volatility persistence).
The indicator standardizes daily returns and computes log-volatility, which is then transformed into an interpretable format. By tracking percentile ranks and dynamically normalizing volatility into a [0,1] range, the script provides a comprehensive view of market risk and potential price movement characteristics.
Why it may be useful
The EGARCH Volatility Estimator is crucial for traders seeking deeper insights into market behavior beyond traditional price analysis. By quantifying volatility with advanced statistical techniques, it helps traders understand underlying market dynamics, risk levels, and potential trend reversals that simple price charts might miss.
This indicator's unique approach of incorporating asymmetric volatility effects allows traders to detect nuanced market conditions where downside or upside volatility dominates. Its normalized visualization and interactive display make complex statistical analysis accessible, enabling more informed decision-making across different trading strategies and market environments.
When to explore it
The EGARCH Volatility Estimator is most effective during periods of market uncertainty, significant economic events, or when trading instruments with complex price behavior. It provides valuable insights for traders managing risk-sensitive portfolios, particularly in markets prone to sudden volatility shifts like cryptocurrencies, options, and high-beta stocks.
Traders can leverage this indicator during trend transitions, potential breakout scenarios, and when assessing overall market sentiment. Its versatility makes it especially useful for quantitative strategies, risk management approaches, and developing sophisticated trading systems that require advanced volatility analysis.
Keep exploring
What we’ve verified
Access, alerts and repainting behaviour have not been independently verified for this indicator. Check the creator’s current publication and settings.
General descriptions and classifications are recovered research. Verified details above identify the specific checks we have completed. Check the creator’s current publication for later changes.