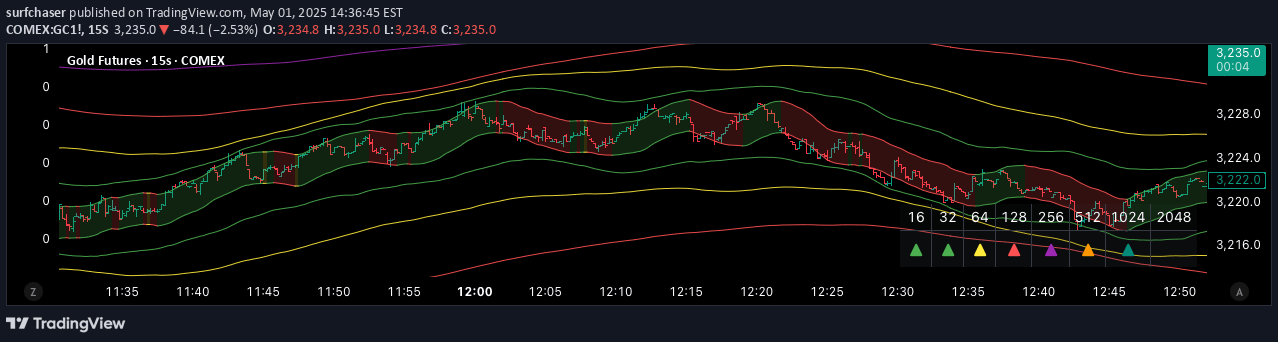
The Elliptic indicator uses a dynamic, cyclical approach to identify market trends and potential reversals by creating adaptive bands around a moving average.
Explore complementary indicator rolesHow it works
The Elliptic indicator creates dynamic bands around a 50-period Simple Moving Average using an ellipse-based mathematical model. It calculates band width by measuring price volatility and applying a multiplier, which allows the bands to expand and contract rhythmically.
The indicator uses an ellipse equation to generate bands that dynamically adjust based on market conditions. By normalizing the x-axis and calculating the y-offset using standard deviation, the bands provide a flexible representation of price movement and potential support and resistance levels.
Why it may be useful
The Elliptic indicator offers traders a more sophisticated approach to trend analysis by introducing non-linear, cyclical variations in price band width. Unlike traditional indicators with fixed standard deviation, this method captures the natural rhythmic patterns of market movements, providing more nuanced insights into potential trend changes.
By dynamically adjusting band width based on volatility, the indicator helps traders identify potential entry and exit points more effectively. The adaptive nature of the bands allows for more responsive trend tracking, making it a valuable tool for understanding market dynamics across different timeframes and asset classes.
When to explore it
The Elliptic indicator is most effective in markets with clear cyclical price movements and moderate volatility. It performs well in trending markets where price tends to respect dynamic support and resistance levels, making it particularly useful for traders seeking to capture trend-based opportunities.
Traders should consider using this indicator during periods of consistent price movement, avoiding extremely choppy or range-bound markets. It is especially valuable when combined with other trend confirmation tools, helping to validate potential trade signals and provide a more comprehensive market analysis.
Keep exploring
What we’ve verified
Access, alerts and repainting behaviour have not been independently verified for this indicator. Check the creator’s current publication and settings.
General descriptions and classifications are recovered research. Verified details above identify the specific checks we have completed. Check the creator’s current publication for later changes.