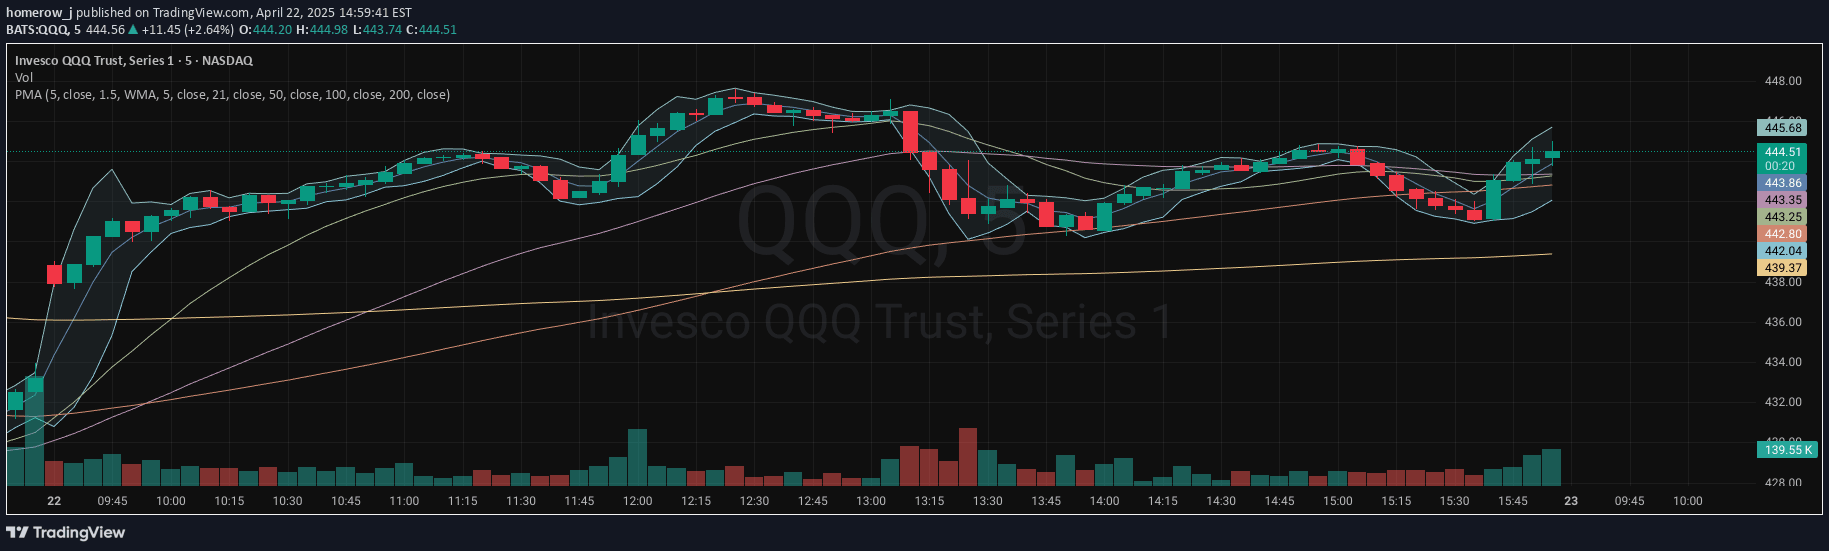
A hybrid indicator combining Exponential Moving Averages and Bollinger Bands to analyze market trends, volatility, and potential price reversals across multiple timeframes.
Explore complementary indicator rolesHow it works
The indicator first calculates four Exponential Moving Averages (EMAs) with periods of 9, 13, 18, and 25, which progressively smooth price data with increasing weight on recent prices. These EMAs help identify trend direction and potential trend changes by showing how different-length moving averages interact with each other.
Simultaneously, the Bollinger Bands are constructed using a simple moving average as the centerline, with upper and lower bands plotted two standard deviations away from this basis. These bands dynamically expand and contract based on recent price volatility, providing visual representation of potential price range and market sentiment.
Why it may be useful
This indicator is crucial for traders because it combines trend identification with volatility analysis, offering a comprehensive view of market conditions in a single tool. The EMAs help traders understand the underlying price momentum and trend direction, while the Bollinger Bands provide insights into potential price reversals and market volatility.
By integrating these two powerful components, traders can make more informed decisions about market entry and exit points, assess potential trend strength, and identify periods of high or low market volatility across different trading timeframes.
When to explore it
The indicator is most effective in markets with clear trending characteristics, where price movements show consistent directional momentum. Traders should apply this signal when seeking to confirm trend strength, identify potential trend reversals, and assess market volatility across various financial instruments and timeframes.
It performs exceptionally well during periods of moderate to high market activity, where price movements are substantial enough to generate meaningful EMA crossovers and trigger Bollinger Band interactions. Traders should be particularly attentive to moments when price touches or breaks through the Bollinger Bands, signaling potential overbought or oversold conditions.
Keep exploring
What we’ve verified
Access, alerts and repainting behaviour have not been independently verified for this indicator. Check the creator’s current publication and settings.
General descriptions and classifications are recovered research. Verified details above identify the specific checks we have completed. Check the creator’s current publication for later changes.