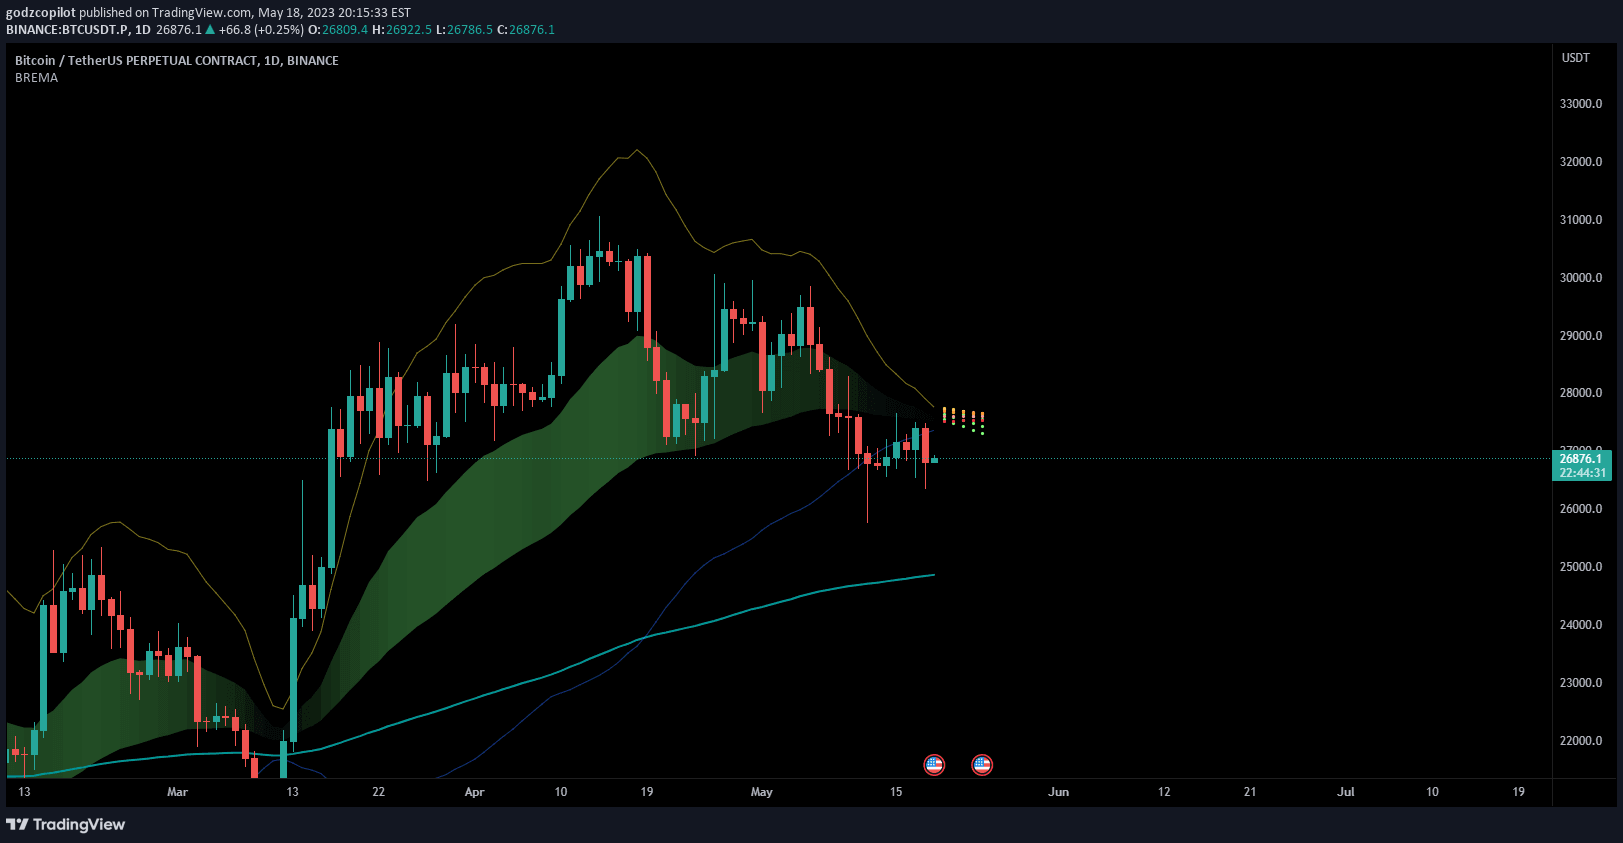
EMA Grid indicator analyzes market sentiment by comparing multiple Exponential Moving Averages to determine trend strength and direction across different timeframes.
Explore complementary indicator rolesHow it works
The EMA Grid indicator calculates market sentiment by systematically analyzing 20 different Exponential Moving Averages (EMAs) with lengths ranging from 5 to 100. It computes the relative distances between consecutive EMAs and creates a cumulative sum that is further smoothed using multiple EMAs with lengths between 3 and 21.
The system then evaluates the relationship between shorter and longer-term EMAs to generate a sentiment rating. When shorter-term EMAs are positioned above longer-term EMAs, the indicator contributes a positive sentiment score, and vice versa. The final rating is normalized to provide a sentiment score between 1 (bullish) and -1 (bearish).
Why it may be useful
The EMA Grid indicator provides traders with a comprehensive view of market momentum by transforming complex moving average relationships into an intuitive visual representation. By smoothing out short-term price fluctuations, it helps traders identify more significant trend movements and reduce market noise.
This approach allows traders to quickly assess market sentiment without getting overwhelmed by minute-by-minute price changes. The color-coded bands between the 100 and 200 EMAs offer an immediate, at-a-glance understanding of trend strength and direction, enabling more informed and strategic trading decisions.
When to explore it
The EMA Grid indicator is most effective in markets with clear, established trends where multiple moving averages can provide meaningful insights into price momentum. It works exceptionally well in liquid markets with sufficient trading volume, such as major forex pairs, large-cap stocks, and popular cryptocurrency pairs.
Traders should utilize this indicator during periods of sustained market movement, avoiding choppy or highly volatile markets where moving average signals might generate conflicting or unreliable information. It is particularly useful for traders seeking a holistic, multi-timeframe perspective on market sentiment and trend dynamics.
Keep exploring
What we’ve verified
Access, alerts and repainting behaviour have not been independently verified for this indicator. Check the creator’s current publication and settings.
General descriptions and classifications are recovered research. Verified details above identify the specific checks we have completed. Check the creator’s current publication for later changes.