A trading signal based on 7-, 14-, and 42-day exponential moving averages that indicates market trend direction through color-coded changes, helping traders identify potential entry and exit points.
Explore complementary indicator rolesHow it works
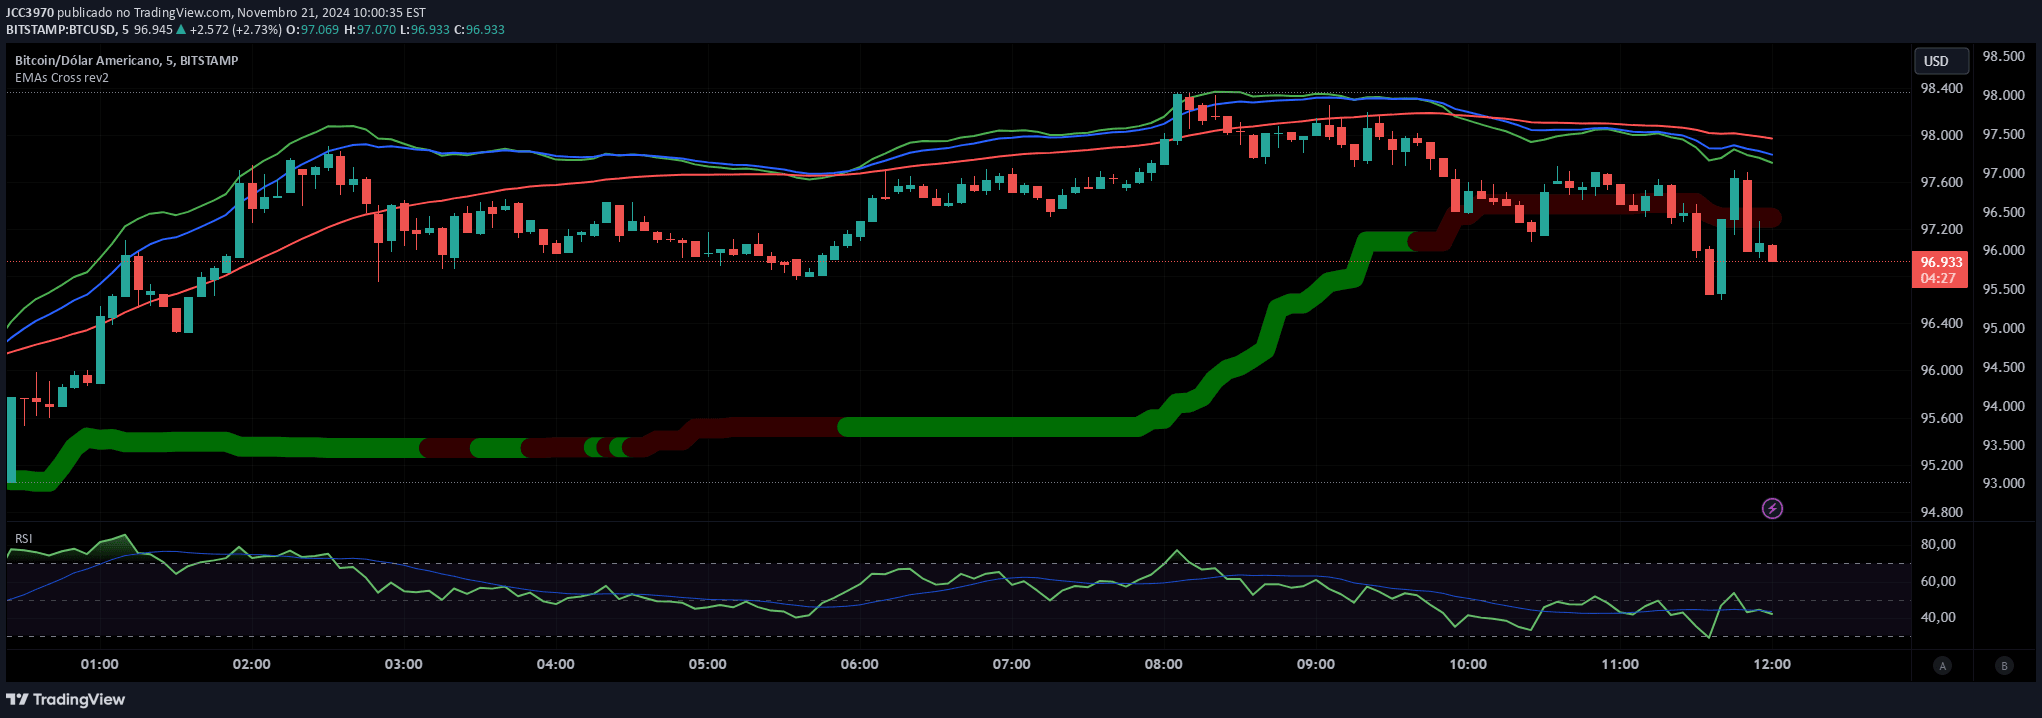
The signal operates by tracking three exponential moving averages (7-, 14-, and 42-day periods) and analyzing their interactions and relative positions. By comparing these moving averages, the indicator generates color-coded signals that represent different market conditions and potential trend changes.
The color scheme provides visual insights into market momentum: yellow indicates the beginning of an uptrend, green confirms an established uptrend, and brown signals a potential downtrend. Traders can observe these color transitions to understand the current market dynamics and make more informed trading decisions.
Why it may be useful
This trading signal provides traders with a clear, visual representation of market trends by simplifying complex moving average interactions into an intuitive color-coded system. By translating technical analysis into an easy-to-understand format, the indicator helps traders quickly assess market direction and potential trend reversals.
The signal's strength lies in its ability to offer immediate visual feedback about market momentum, allowing traders to make more timely and informed decisions. When used in conjunction with other indicators like RSI, it can provide a more comprehensive view of market conditions and potential trading opportunities.
When to explore it
The signal is most effective in markets with clear trending characteristics, where price movements are more predictable and directional. It works particularly well in markets that demonstrate consistent momentum and where moving averages can effectively capture underlying price trends.
Traders should consider using this signal during periods of stable market conditions, such as in trending markets or when trading assets with relatively smooth price movements. It is especially useful for day traders and swing traders who want a quick, visual method of identifying potential entry and exit points based on moving average interactions.
Keep exploring
What we’ve verified
Access, alerts and repainting behaviour have not been independently verified for this indicator. Check the creator’s current publication and settings.
General descriptions and classifications are recovered research. Verified details above identify the specific checks we have completed. Check the creator’s current publication for later changes.