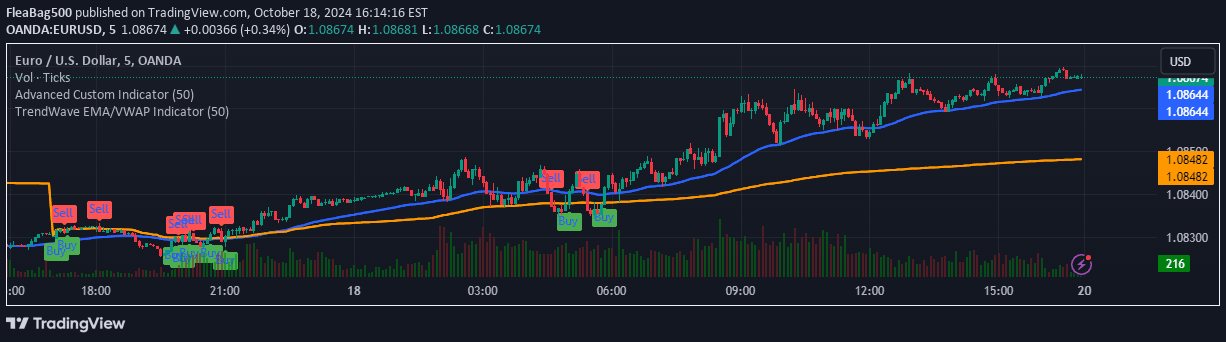
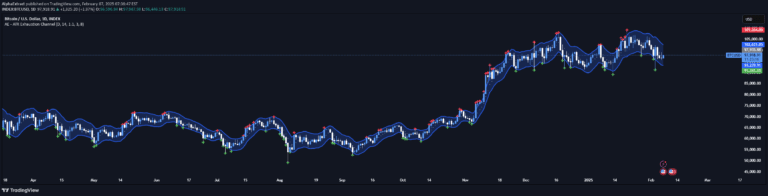
A multi-EMA indicator that tracks market trends by analyzing the relationship between different exponential moving averages and identifying trend changes and duration.
Explore complementary indicator rolesHow it works
The indicator calculates six exponential moving averages (EMAs) with periods ranging from 5 to 150, creating a comprehensive view of price momentum. By comparing these EMAs, the script determines trend direction through their sequential order, with an uptrend defined when EMAs progressively increase from shorter to longer periods.
The algorithm tracks trend changes by monitoring EMA relationships and generates visual representations of these trends using color-coded lines and labels. When the EMA sequence breaks, it signals a potential trend reversal, allowing traders to understand the market's current momentum and potential directional shifts.
Why it may be useful
This multi-EMA indicator provides traders with a nuanced understanding of market trends by using multiple timeframes simultaneously. By analyzing EMAs across different periods, traders can gain insights into both short-term and long-term price movements, helping them make more informed trading decisions.
The visual representation of trends, including color-coded lines and labels showing trend duration and price change percentage, helps traders quickly interpret market conditions. This approach reduces subjectivity in trend analysis and provides a systematic method for identifying potential entry and exit points.
When to explore it
The multi-EMA indicator is most effective in markets with clear trending behavior, such as forex, stocks, and cryptocurrencies. It works best in markets experiencing consistent directional movements, where price trends are more pronounced and sustained over time.
Traders should use this indicator in conjunction with other technical analysis tools to confirm signals and reduce false positives. It is particularly useful during periods of market volatility, helping traders understand underlying trend dynamics and potential trend reversals across multiple timeframes.
Keep exploring
What we’ve verified
Access, alerts and repainting behaviour have not been independently verified for this indicator. Check the creator’s current publication and settings.
General descriptions and classifications are recovered research. Verified details above identify the specific checks we have completed. Check the creator’s current publication for later changes.