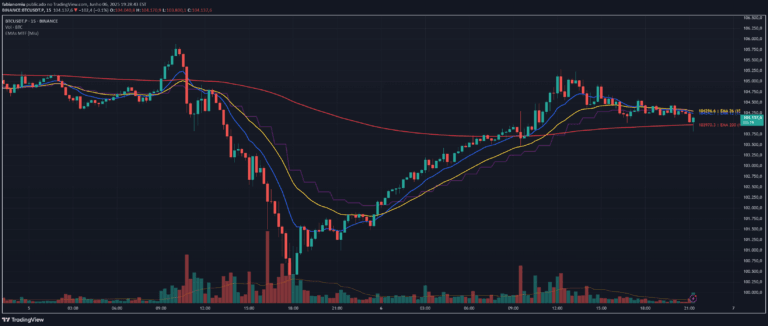
A visual trading indicator using EMAs that plots light ray-like lines to help traders understand price action, trend dynamics, and potential entry/exit points with psychological discipline.
Explore complementary indicator rolesHow it works
The Emergent Rays indicator plots a series of Exponential Moving Average (EMA) rays in different colors across the price chart, representing various trend levels and potential support/resistance zones. These rays are created by tracking high and low values, with each ray representing a different period and color gradient that visually demonstrates price expansion and trend strength.
As price moves, the rays adjust, showing how market trends develop and change. When price touches or retests these rays, traders can observe potential entry and exit points, with the color gradient from red to blue indicating increasing risk and potential stop-loss levels.
Why it may be useful
This indicator helps traders overcome emotional trading by providing a structured visual representation of market trends and potential entry/exit points. By presenting price action through light ray-like EMAs, it encourages disciplined trading and helps traders manage risk more effectively by showing trend dynamics and potential pullback zones.
The visual gradient allows traders to quickly assess market conditions, understand trend strength, and make more informed decisions without relying solely on emotions. It promotes a systematic approach to trading by helping traders recognize when to enter, exit, or wait for clearer trend signals.
When to explore it
The Emergent Rays indicator works best in clear trending markets, both during uptrends and downtrends, where price is consistently moving in a specific direction. During uptrends, traders can look for long position entries on pullbacks to the rays, with stop-losses set below the lowest rays, indicating the trend might be changing.
In downtrends, traders can seek short position entries on pullbacks, using the rays as guide points for potential entries and stop-losses. The indicator is less effective during range-bound or consolidating markets, where price movement is less directional and the rays tend to merge, signaling a lack of clear trend.
Keep exploring
What we’ve verified
Access, alerts and repainting behaviour have not been independently verified for this indicator. Check the creator’s current publication and settings.
General descriptions and classifications are recovered research. Verified details above identify the specific checks we have completed. Check the creator’s current publication for later changes.