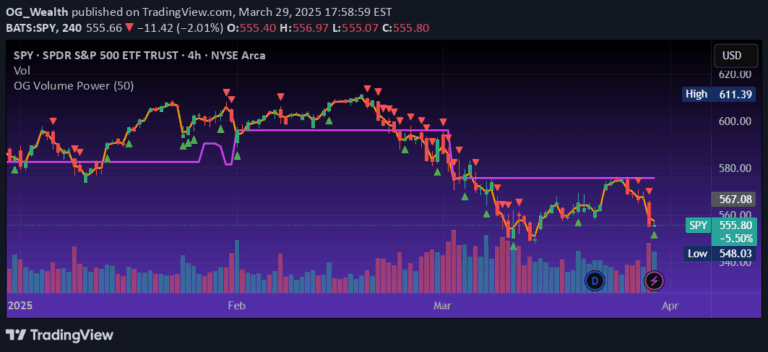
A custom indicator detecting Money Flow Index (MFI) divergences to anticipate potential price reversals by comparing price action with momentum strength.
Explore complementary indicator rolesHow it works
The MFI Divergence indicator analyzes price action and Money Flow Index to identify potential trend reversals by comparing local highs and lows. It detects bullish divergence when price makes a lower low while MFI forms a higher low, and bearish divergence when price creates a higher high but MFI forms a lower high.
The script employs pivot point logic to mark significant swing points, filtering out market noise and focusing on meaningful momentum shifts. Optional confirmation filters can be applied, such as checking MFI levels above or below 50 to validate signal strength and provide additional trading insights.
Why it may be useful
This indicator helps traders anticipate potential price reversals by revealing hidden momentum strength or weakness that might not be immediately apparent from price action alone. By comparing price movements with the volume-weighted Money Flow Index, traders can gain deeper insights into underlying market dynamics and potential trend changes.
The visual markers, including colored triangles and optional background shading, make it easier for traders to quickly identify and interpret potential trading opportunities. This approach allows for more nuanced decision-making by incorporating volume-based momentum analysis alongside traditional price action strategies.
When to explore it
The MFI Divergence indicator works best in markets with clear trending or ranging conditions, providing valuable insights across various timeframes and asset classes. It is particularly effective when used in conjunction with other technical analysis tools like moving averages, support/resistance zones, and volume indicators.
Traders should apply this indicator in markets with sufficient liquidity and when seeking to confirm potential trend reversals or identify early signs of momentum shifts. It is most reliable when used as part of a comprehensive trading strategy that includes multiple confirmation signals and risk management techniques.
Keep exploring
What we’ve verified
Access, alerts and repainting behaviour have not been independently verified for this indicator. Check the creator’s current publication and settings.
General descriptions and classifications are recovered research. Verified details above identify the specific checks we have completed. Check the creator’s current publication for later changes.