
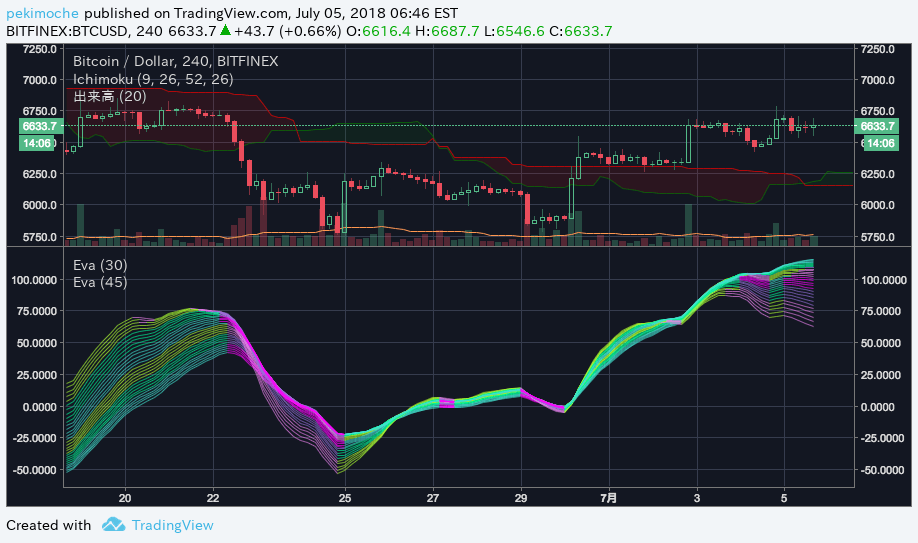
An advanced oscillator using IIR Filter and MACD Histogram to detect the most powerful market frequency, helping traders identify cycle dynamics and potential trading opportunities.
Explore complementary indicator rolesHow it works
The IIR Filter with Multiple MACD Histogram works by analyzing market cycles through complex frequency detection algorithms. It processes price data using an Infinite Impulse Response (IIR) filter, which helps smooth and transform raw price signals. The indicator then applies multiple MACD histogram layers to identify different cyclical patterns and frequencies within the market.
By calculating these dynamic cycles, the oscillator can detect subtle shifts in market momentum and trend strength. The filter essentially breaks down price movements into their fundamental frequency components, allowing traders to understand underlying market rhythms
Why it may be useful
This advanced oscillator provides traders with a sophisticated tool for understanding market cycles and potential turning points. By detecting the most powerful frequencies in price movements, it offers insights beyond traditional technical indicators. Traders can use this information to anticipate potential trend reversals, validate existing trends, and make more informed trading decisions.
The multi-layered approach allows for a more nuanced view of market dynamics, potentially revealing hidden patterns that simpler indicators might miss. Understanding these cycles can help traders improve timing, reduce false signals, and develop more robust trading strategies
When to explore it
The IIR Filter with Multiple MACD Histogram works best in markets with clear cyclical behavior, such as forex, commodities, and specific stock indices. It is particularly effective during trending market conditions where price movements exhibit consistent rhythmic patterns.
Traders should apply this indicator when seeking to confirm trend strength, identify potential trend reversals, and understand underlying market frequencies. It is most reliable on timeframes ranging from daily to weekly charts, where longer-term cycles become more apparent. Experienced traders can use this tool to complement other technical analysis methods and develop more comprehensive trading strategies
Keep exploring
What we’ve verified
Access, alerts and repainting behaviour have not been independently verified for this indicator. Check the creator’s current publication and settings.
General descriptions and classifications are recovered research. Verified details above identify the specific checks we have completed. Check the creator’s current publication for later changes.


