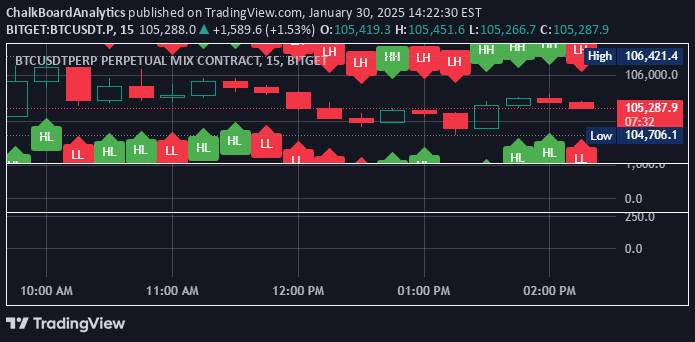
A trading indicator that identifies exact equal highs and lows between consecutive candles, marking potential liquidity pools with visual arrows on the chart.
Explore complementary indicator rolesHow it works
The indicator analyzes consecutive price candles to detect precise matches in their high or low price levels. When the current candle's high exactly matches the previous candle's high (or low matches low), the indicator automatically plots an arrow on the chart to highlight this specific price level.
These arrows serve as visual markers for potential liquidity pools, which are areas where significant trading activity might occur. The arrows dynamically update, disappearing if any subsequent candle breaks the originally identified high or low, ensuring that only current and relevant liquidity zones are displayed.
Why it may be useful
Identifying liquidity pools is crucial for traders seeking to understand potential areas of market interest and price interaction. These zones represent levels where significant buying or selling pressure might emerge, offering traders strategic insights into potential market movements and entry/exit points.
By providing a clear visual representation of these precise price levels, the indicator helps traders quickly recognize areas of potential market activity. This can be particularly valuable in volatile markets where understanding subtle price dynamics can provide a competitive edge in decision-making.
When to explore it
This indicator is most effective in markets with clear, well-defined price movements and consistent trading volumes. It works particularly well in timeframes that capture short-term price fluctuations, such as intraday or scalping charts where precise price levels can indicate immediate market sentiment.
Traders should use this signal in conjunction with other technical analysis tools to confirm potential trading opportunities. It is especially useful in markets like forex, futures, and actively traded stocks where liquidity pools can significantly influence price action and provide valuable trading insights.
Keep exploring
What we’ve verified
Access, alerts and repainting behaviour have not been independently verified for this indicator. Check the creator’s current publication and settings.
General descriptions and classifications are recovered research. Verified details above identify the specific checks we have completed. Check the creator’s current publication for later changes.