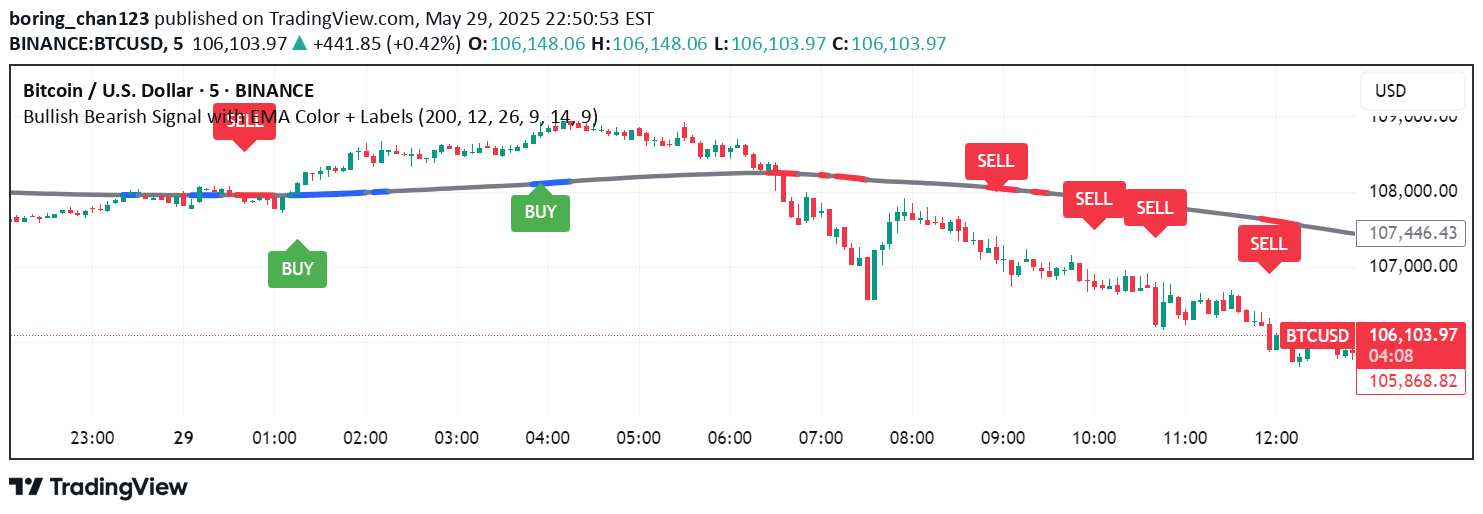
Farzan Paid Caliburn is a trend-following indicator using candlestick charting techniques to identify market direction through blue and black candles representing uptrends and downtrends.
Explore complementary indicator rolesHow it works
The Farzan Paid Caliburn indicator operates by analyzing price action through candlestick formations, utilizing open, high, low, and close prices from the previous trading session. It creates a visual representation of market trends using color-coded candles, with blue candles signaling an uptrend and black candles indicating a downtrend.
Traders can apply this indicator across different timeframes, including daily, weekly, and intraday charts. By plotting these specialized candlesticks in a separate panel beneath the main price chart, the indicator helps traders quickly interpret the current market momentum and potential trend direction.
Why it may be useful
The Farzan Paid Caliburn provides traders with a straightforward visual method to understand market trends and potential price movements. By simplifying complex price action into color-coded candles, it allows traders to make more informed decisions about potential entry and exit points in various financial markets.
Its versatility across different instruments like stocks, futures, and forex makes it a valuable tool for traders seeking to understand market dynamics. The indicator's ability to smooth out price fluctuations helps traders cut through market noise and focus on meaningful trend information.
When to explore it
The Farzan Paid Caliburn is most effective when used on weekly charts, providing a broader perspective on market trends and reducing the impact of short-term price volatility. Traders can optimize its use by applying it to specific timeframes and financial instruments where trend identification is crucial.
It works best in markets with clear directional movements, helping traders identify potential trend reversals and continuations. Ideal for both day trading and swing trading strategies, the indicator is particularly useful when combined with other technical analysis tools to confirm market signals.
Keep exploring
What we’ve verified
Access, alerts and repainting behaviour have not been independently verified for this indicator. Check the creator’s current publication and settings.
General descriptions and classifications are recovered research. Verified details above identify the specific checks we have completed. Check the creator’s current publication for later changes.