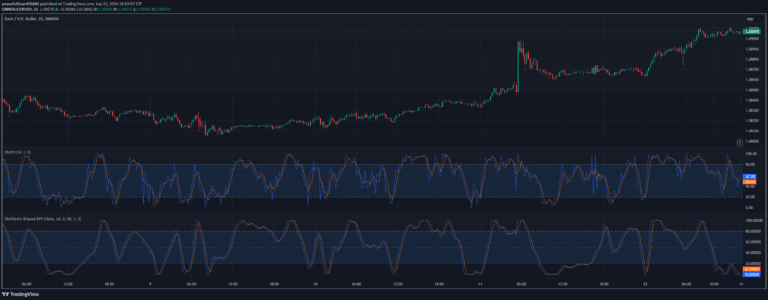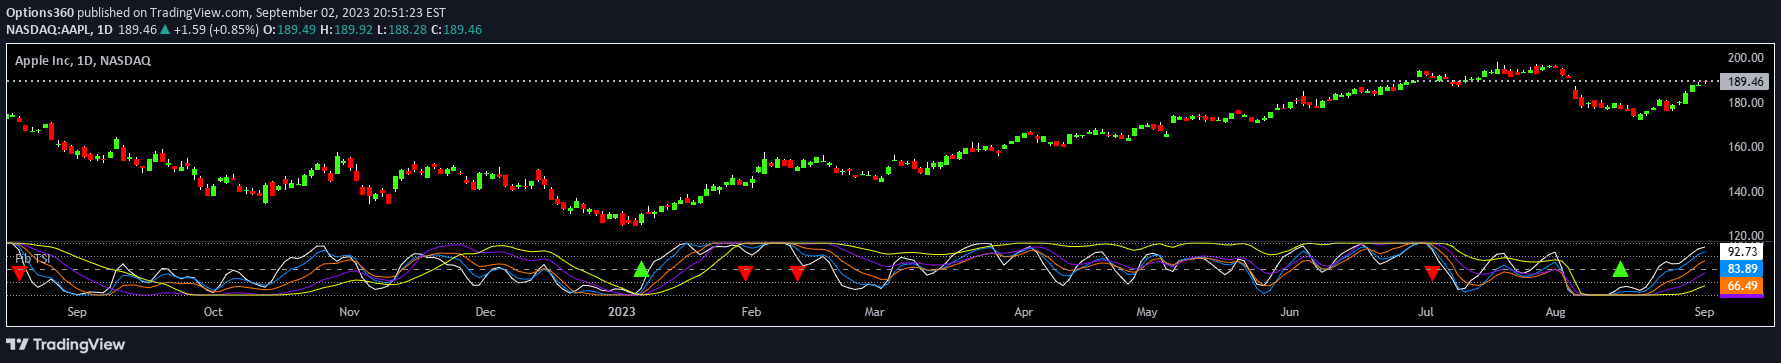
Fibonacci True Strength Index combines Fibonacci numbers with momentum analysis, converting price movement into a stochastic oscillator that ranges from 0-100 to indicate market trends and potential reversals.
Explore complementary indicator rolesHow it works
The Fib TSI indicator uses Fibonacci sequence numbers to calculate moving averages of price momentum, creating a dynamic oscillator that tracks market movement. It applies two moving averages to analyze underlying price momentum, with different Fibonacci lengths like 3/5, 5/8, 8/13, 13/21, and 21/34 to provide multiple perspectives on price trends.
The indicator then converts these momentum calculations into a stochastic scale from 0-100, allowing traders to easily interpret market conditions. By smoothing and comparing different moving average lengths, the Fib TSI provides a nuanced view of price momentum that adapts to changing market dynamics.
Why it may be useful
The Fib TSI offers traders a sophisticated tool for understanding market momentum by leveraging the mathematically significant Fibonacci sequence. It provides clear visual signals about market trends, helping traders identify potential entry and exit points with greater precision and confidence.
By using multiple moving average lengths based on Fibonacci numbers, the indicator can capture subtle shifts in market sentiment that might be missed by simpler momentum indicators. The stochastic scaling from 0-100 makes it easy to quickly interpret overbought and oversold conditions, making complex market analysis more accessible.
When to explore it
The Fib TSI is most effective in markets with clear trending behavior, where momentum signals can provide reliable insights into potential price movements. It works particularly well in financial instruments that exhibit cyclical patterns and respond to momentum shifts, such as stocks, forex, and cryptocurrency markets.
Traders should use the Fib TSI in conjunction with other technical analysis tools to confirm signals and reduce false positives. The indicator is especially useful during periods of market transition, helping traders identify potential trend reversals and momentum changes across different timeframes.
Keep exploring
What we’ve verified
Access, alerts and repainting behaviour have not been independently verified for this indicator. Check the creator’s current publication and settings.
General descriptions and classifications are recovered research. Verified details above identify the specific checks we have completed. Check the creator’s current publication for later changes.