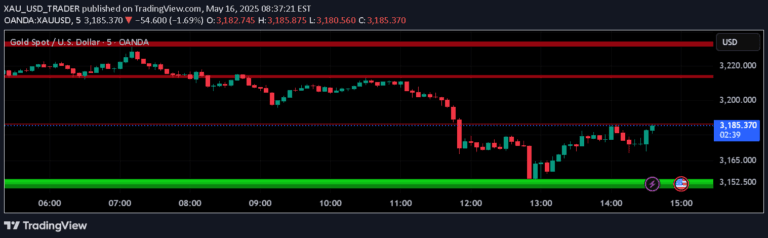
An advanced Fibonacci indicator that automatically draws dynamic levels between swing highs and lows across multiple timeframes to identify potential support and resistance zones.
Explore complementary indicator rolesHow it works
The indicator identifies swing highs and lows by analyzing price action, tracking consecutive green and red candles to determine peak and trough prices. It then automatically draws Fibonacci retracement and extension levels based on the current wave cycle, using a higher timeframe resolution to provide more comprehensive market insights.
The system calculates levels using specific Fibonacci ratios like 23.6%, 38.2%, 61.8%, and 100%, creating horizontal lines that represent potential support and resistance zones. By dynamically adjusting these levels based on the most recent price movements, traders can quickly visualize potential price reversal or continuation points.
Why it may be useful
Fibonacci levels provide traders with mathematical insights into potential market turning points by leveraging naturally occurring mathematical relationships in price movements. These levels help identify key support and resistance zones where price might potentially pause, reverse, or continue its current trend, offering valuable strategic entry and exit points.
By integrating multiple timeframe analysis, the indicator enhances traders' understanding of market dynamics beyond the immediate chart. The objective mathematical approach reduces emotional decision-making and provides a structured framework for analyzing price action across different market conditions.
When to explore it
The Fibonacci indicator works best in trending markets with clear directional movements, where price respects mathematical retracement and extension levels. It is particularly effective in markets with consistent price swings and when used in conjunction with other technical analysis tools to confirm potential trade setups.
Traders should pay special attention to this indicator during periods of market consolidation or when price approaches key Fibonacci levels, as these zones often represent potential turning points. However, it's crucial to combine this tool with other technical and fundamental analysis to increase the probability of successful trades.
Keep exploring
What we’ve verified
Access, alerts and repainting behaviour have not been independently verified for this indicator. Check the creator’s current publication and settings.
General descriptions and classifications are recovered research. Verified details above identify the specific checks we have completed. Check the creator’s current publication for later changes.