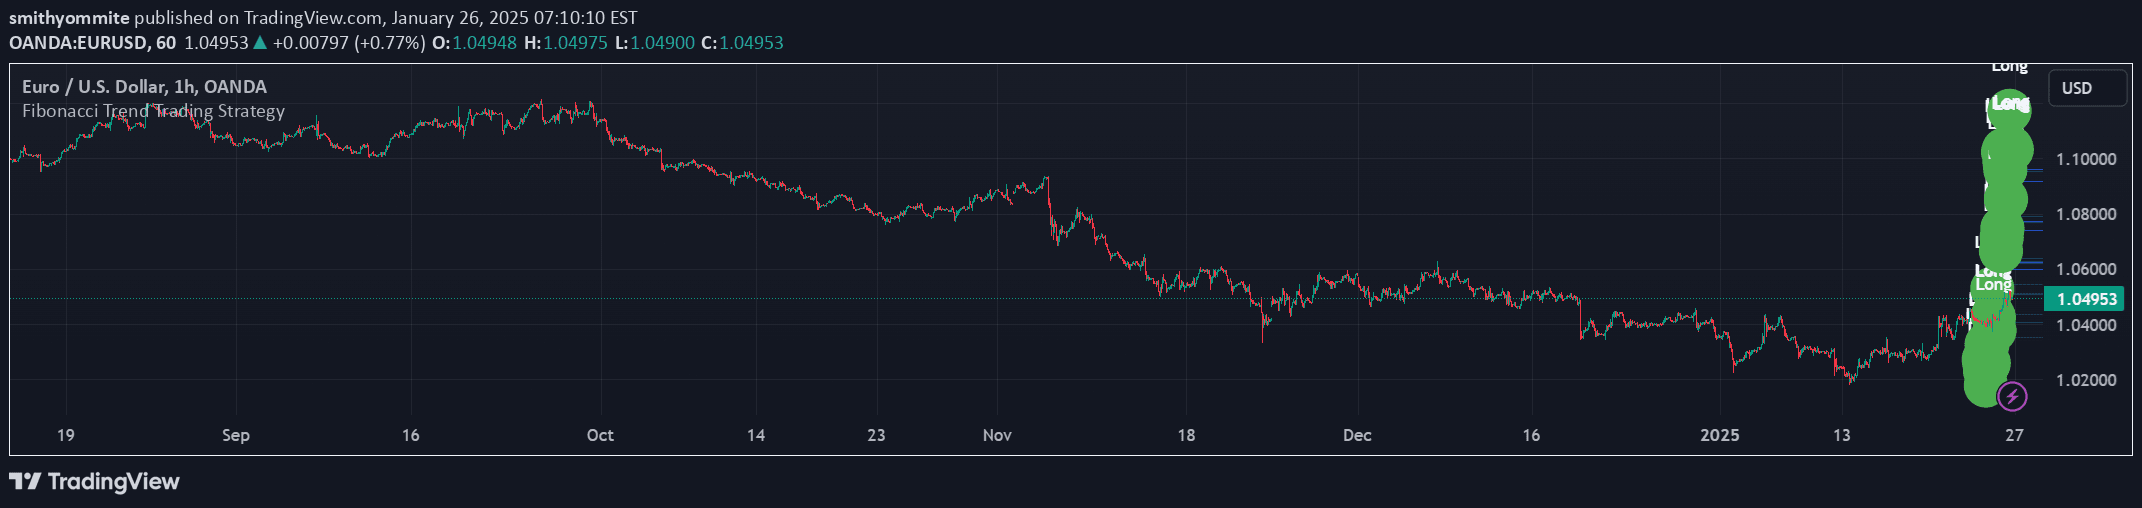
Fibonacci indicator that automatically draws dynamic support and resistance levels based on wave cycles, helping traders identify potential price reversal and continuation zones.
Explore complementary indicator rolesHow it works
The Fibonacci indicator automatically identifies swing highs and swing lows in price action, creating a dynamic range between current peak and trough. It calculates Fibonacci retracement and extension levels using ratios like 23.6%, 38.2%, 61.8%, and 100%, which are drawn as horizontal lines on the chart.
The indicator adapts its range depending on the wave cycle, drawing from peak to trough or trough to peak based on where the current wave cycle concludes. By analyzing consecutive green and red candles, it determines swing points and creates a visual representation of potential support and resistance levels.
Why it may be useful
Fibonacci levels provide traders with a mathematical approach to identifying potential price reversal and continuation zones based on natural market rhythms. These levels help traders make more informed decisions by highlighting key price areas where market sentiment might change or momentum could shift.
The indicator's dynamic nature allows traders to quickly understand market structure and potential price targets. By automatically drawing levels based on recent price action, it reduces manual calculation time and provides a systematic method for analyzing market movements across different timeframes.
When to explore it
The Fibonacci indicator works best in markets with clear trending behavior and identifiable wave cycles. It is particularly effective in liquid markets like forex, stocks, and cryptocurrencies where price movements tend to respect mathematical retracement levels.
Traders should use this indicator in conjunction with other technical analysis tools to confirm potential entry and exit points. It is most reliable in markets with consistent volatility and when used across multiple timeframes to validate potential support and resistance levels.
Keep exploring
What we’ve verified
Access, alerts and repainting behaviour have not been independently verified for this indicator. Check the creator’s current publication and settings.
General descriptions and classifications are recovered research. Verified details above identify the specific checks we have completed. Check the creator’s current publication for later changes.