
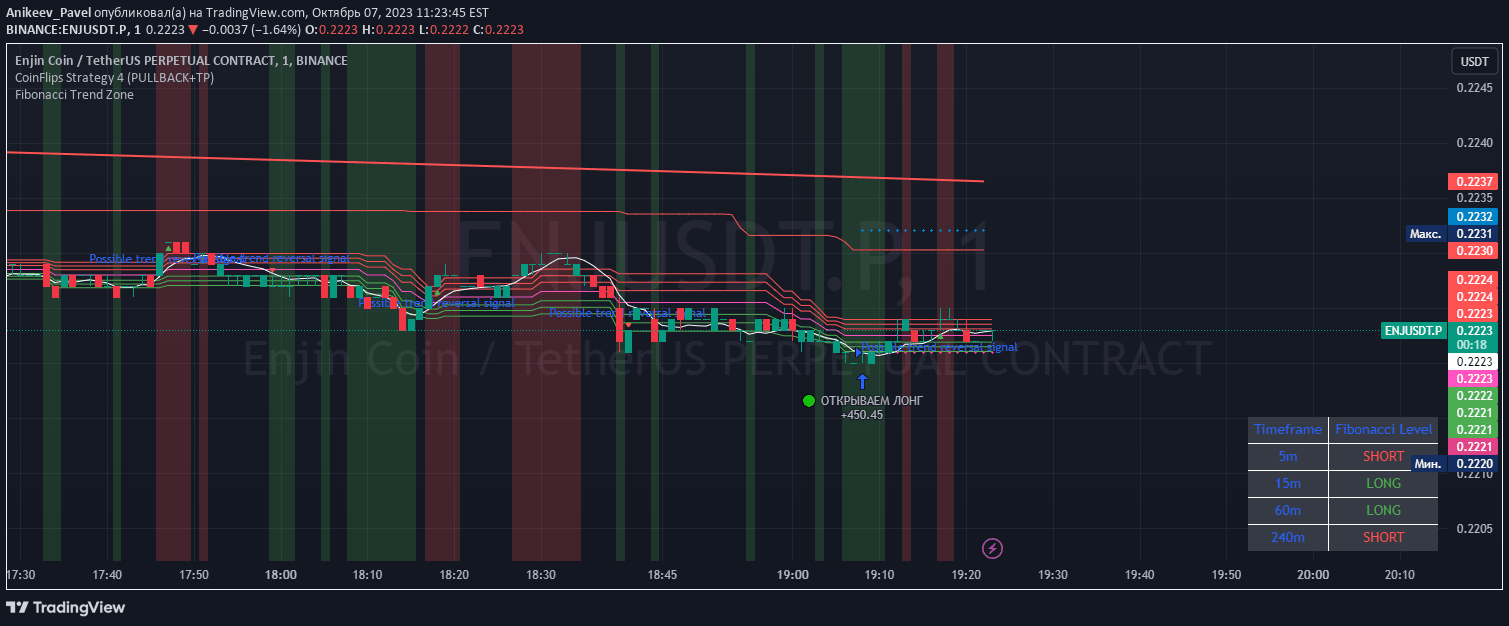
A Fibonacci-based trend indicator that uses specific levels and TEMA to identify potential trend zones and reversals in financial markets.
Explore complementary indicator rolesHow it works
The Fibonacci Trend Zone indicator operates by utilizing specific Fibonacci levels (0.62, 0.705, and 0.79) to define long-term trend zones on a price chart. It creates color-coded zones that visually represent potential trading directions, with green zones indicating long trade opportunities and red zones suggesting short trade possibilities.
The indicator incorporates the Triple Exponential Moving Average (TEMA) as an additional confirmation tool. When the TEMA crosses the Fibonacci level of 0.5, it may signal a potential trend reversal, providing traders with a dynamic method of identifying market momentum shifts. The indicator's flexible design allows traders to customize visual elements and adapt the tool to their specific trading preferences and analysis requirements.
Why it may be useful
The Fibonacci Trend Zone indicator is crucial for traders seeking a comprehensive approach to trend analysis and market direction identification. By combining Fibonacci levels with TEMA, the indicator offers a multi-dimensional view of market dynamics that goes beyond traditional single-indicator approaches. It helps traders make more informed decisions by providing visual cues about potential trend movements and reversals.
Moreover, the indicator's ability to adapt to different trading styles and its customizable features make it a versatile tool for various market participants. Traders can modify color schemes and display settings to match their individual preferences, enhancing the indicator's usability and integration into existing trading strategies.
When to explore it
The Fibonacci Trend Zone indicator is most effective in markets with clear trending characteristics, such as forex, stocks, and cryptocurrency markets. It performs optimally in timeframes ranging from daily to weekly charts, where longer-term trend dynamics are more pronounced and meaningful. Traders should use this indicator in conjunction with other technical analysis tools to confirm signals and reduce false positives.
The indicator is particularly useful during periods of market transition, where identifying potential trend reversals can provide significant trading advantages. Traders should pay special attention to TEMA crossovers at Fibonacci levels and look for confluence with other technical indicators to strengthen their trading decisions and improve overall strategy reliability.
Keep exploring
What we’ve verified
Access, alerts and repainting behaviour have not been independently verified for this indicator. Check the creator’s current publication and settings.
General descriptions and classifications are recovered research. Verified details above identify the specific checks we have completed. Check the creator’s current publication for later changes.


