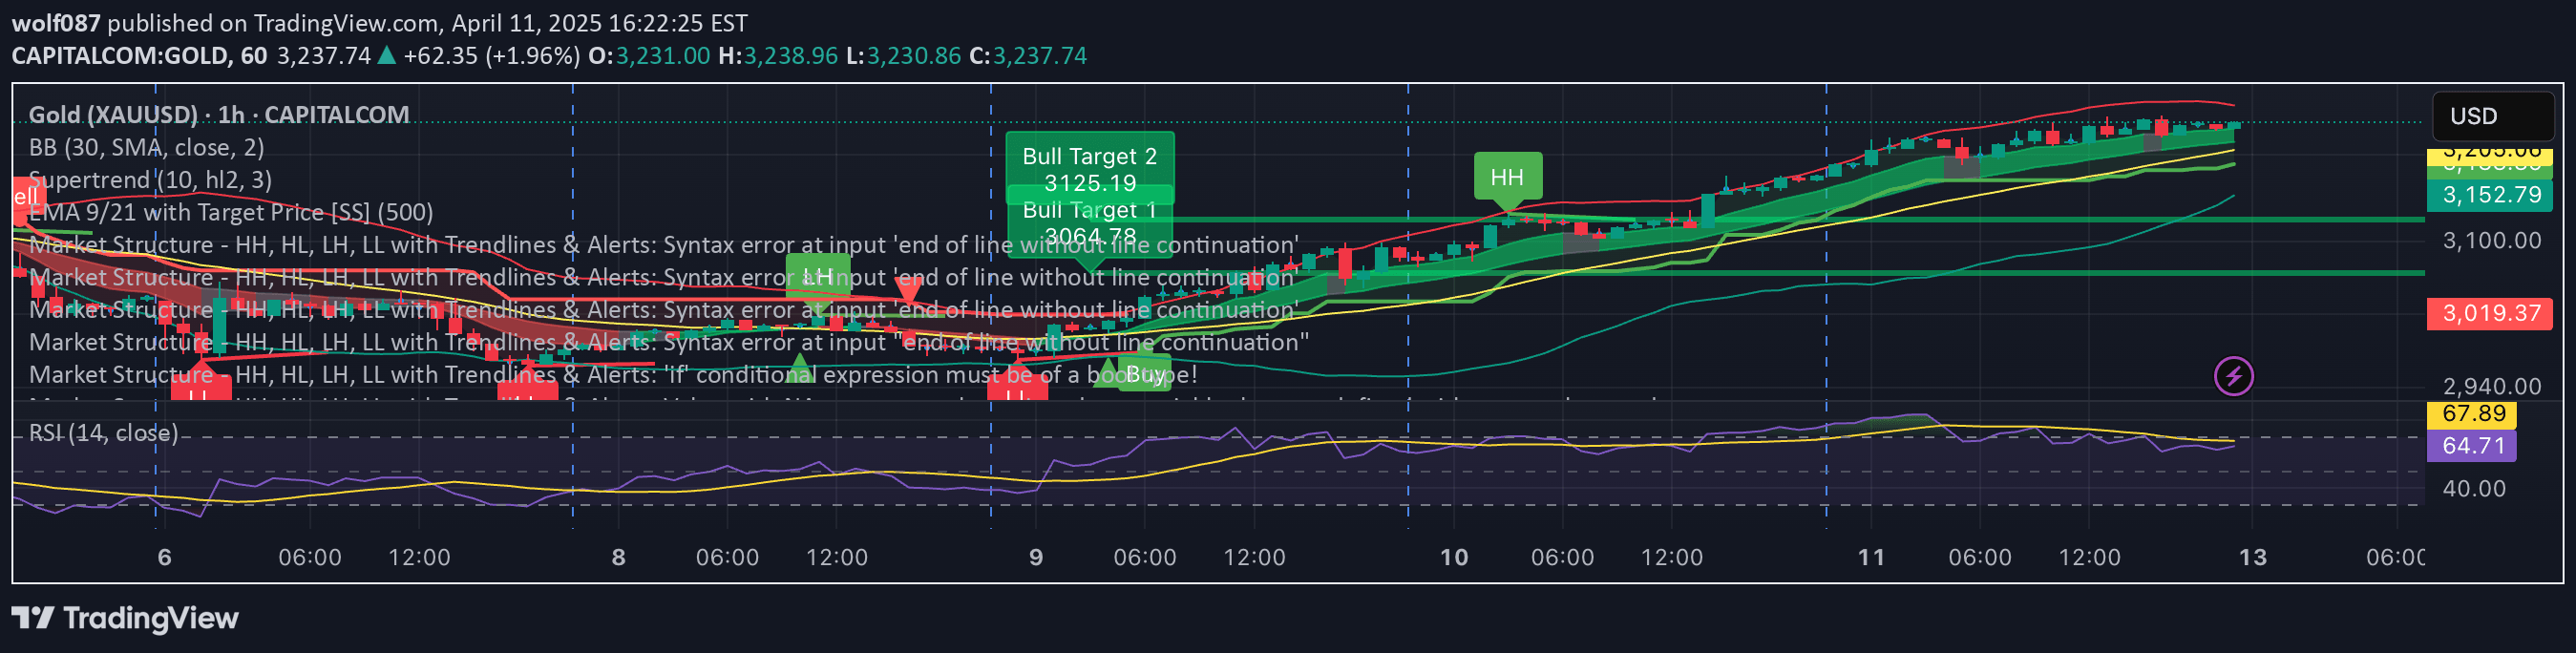
A multi-timeframe trading indicator using SuperTrend and Fibonacci levels to identify potential entry and exit points in trending markets with customizable settings.
Explore complementary indicator rolesHow it works
The indicator uses two SuperTrend indicators across multiple timeframes to determine market trend direction. When both high and main timeframe SuperTrend indicators align, it generates trade signals by plotting Fibonacci levels between pivot points and the SuperTrend line.
For uptrends, it draws Fibonacci levels between the pivot high point and SuperTrend line, while downtrends use pivot low points. The TakeProfit level is calculated by multiplying the distance between lowest and highest points, providing potential exit points for traders.
Why it may be useful
This indicator helps traders identify low-risk entry points within the primary market trend by combining multiple technical analysis tools. By integrating SuperTrend and Fibonacci levels, it provides a comprehensive approach to trend identification and potential profit targets.
The multi-timeframe analysis allows for more nuanced market interpretation, reducing the likelihood of false signals and improving trade decision-making. Its customizable settings enable traders to adapt the indicator to different market conditions and personal trading strategies.
When to explore it
The indicator works best in trending markets with clear directional movement, where SuperTrend and Fibonacci levels can effectively highlight potential trade opportunities. It is particularly useful for traders seeking to enter trades at relatively low-risk points within the established trend.
Traders should use this indicator in conjunction with other technical and fundamental analysis tools to confirm signals and manage risk. It is most effective on timeframes that provide sufficient market detail, such as daily, 4-hour, and 1-hour charts.
Keep exploring
What we’ve verified
Access, alerts and repainting behaviour have not been independently verified for this indicator. Check the creator’s current publication and settings.
General descriptions and classifications are recovered research. Verified details above identify the specific checks we have completed. Check the creator’s current publication for later changes.