
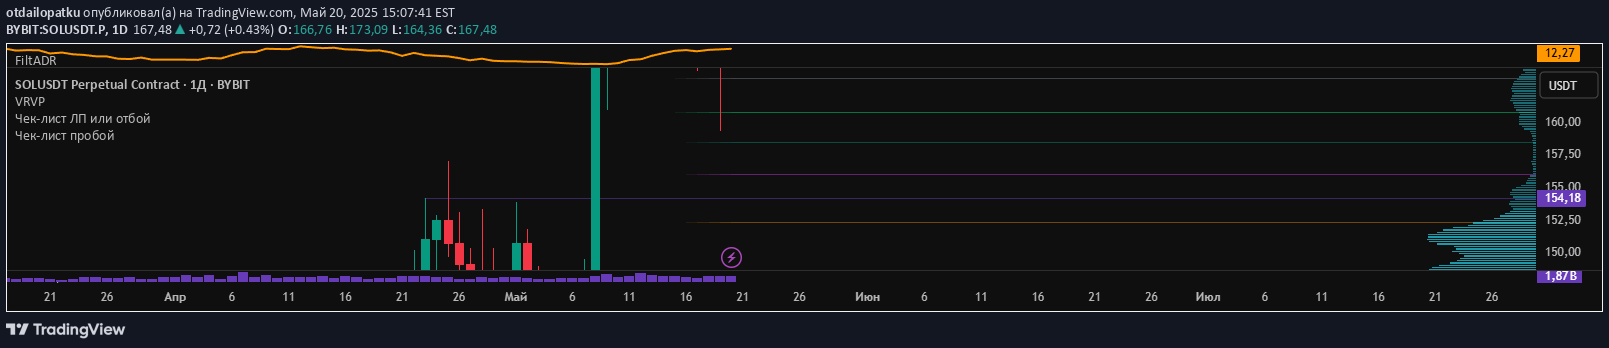
A refined Average Daily Range indicator that filters out extreme price ranges to provide a more stable volatility measurement across 14 daily candles.
Explore complementary indicator rolesHow it works
The Filtered Average Daily Range (Filt ADR) begins by calculating daily price ranges over the past 14 candles by identifying the difference between each day's high and low prices. These ranges are collected into an array, ensuring no missing data points are included in the calculation.
The script then performs an outlier filtering process by first computing an initial average range and then eliminating extreme values that fall outside 0.5 to 2 times this average. By removing abnormally small or large daily ranges, the indicator creates a more representative and stable volatility measurement that smooths out potential statistical distortions.
Why it may be useful
Traditional volatility measurements can be skewed by occasional extreme price movements, which can lead traders to make inaccurate assessments about market behavior. By filtering out these outliers, the Filt ADR provides a more reliable and consistent representation of true market volatility.
This refined approach helps traders develop more precise risk management strategies, enabling more accurate position sizing, stop-loss placement, and potential profit target estimation. The indicator's ability to normalize volatility measurements makes it a valuable tool for traders seeking a balanced and mathematically sound approach to understanding market dynamics.
When to explore it
The Filtered ADR is most effective in markets with moderate to high volatility where daily price ranges can vary significantly. It works particularly well for traders who need a robust, smoothed volatility indicator that reduces the impact of anomalous price movements.
Traders should consider using this indicator when developing trading strategies that require a stable volatility baseline, such as setting adaptive stop-loss levels, calculating position sizes, or identifying potential breakout or trend continuation scenarios. It is especially useful in markets like forex, futures, and actively traded stocks where daily price ranges can exhibit considerable variation.
Keep exploring
What we’ve verified
Access, alerts and repainting behaviour have not been independently verified for this indicator. Check the creator’s current publication and settings.
General descriptions and classifications are recovered research. Verified details above identify the specific checks we have completed. Check the creator’s current publication for later changes.


