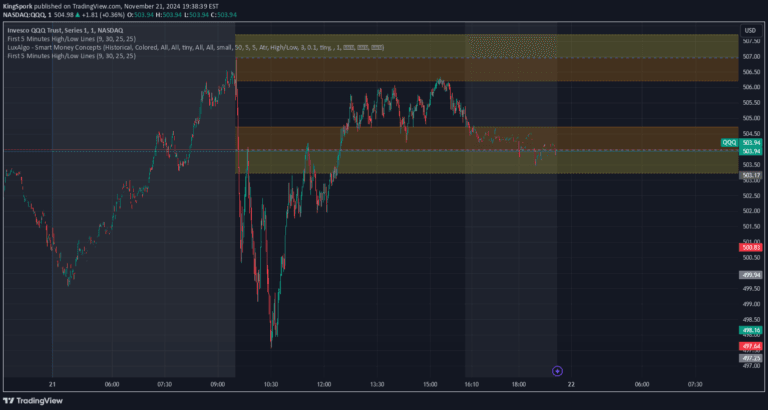
A TradingView indicator that captures and visualizes the high and low prices of the first 5-minute candle, helping traders identify key intraday support and resistance levels.
Explore complementary indicator rolesHow it works
The First 5-Minute Candle Box Indicator works by automatically tracking the high and low prices of the first 5-minute candle during each trading day. At the market open, the script begins monitoring price action, capturing the extreme points of the initial candle formation. It then creates a visual rectangle on the chart that spans the entire trading day, representing the range between the first candle's high and low points.
The indicator uses daily reset logic to ensure accuracy, clearing previous day's data and starting fresh with each new trading session. This approach allows traders to consistently identify early price levels without manual intervention, providing a systematic method for visualizing key intraday price parameters.
Why it may be useful
The First 5-Minute Candle Box Indicator is crucial for traders seeking early insights into market sentiment and potential price movements. By capturing the first 5-minute candle's range, traders can quickly assess initial market dynamics and establish reference points for potential support and resistance levels. This early identification helps traders make more informed decisions about entry and exit points during the trading day.
The visual representation simplifies complex price information, allowing traders to quickly understand market behavior without extensive manual analysis. It provides a standardized approach to interpreting early market signals, helping traders develop more consistent and disciplined trading strategies based on objective price action data.
When to explore it
The indicator is most effective during active trading sessions with significant price movement, particularly in liquid markets like stocks, forex, and futures. Traders can benefit most when using this tool on timeframes that capture intraday volatility, such as 5-minute or 15-minute charts. It is especially useful during market open periods when initial price action can set the tone for the entire trading day.
Traders should combine this indicator with other technical analysis tools to confirm signals and develop comprehensive trading strategies. It works best for traders who focus on short-term price movements and want to quickly assess market sentiment during the early stages of a trading session.
Keep exploring
What we’ve verified
Access, alerts and repainting behaviour have not been independently verified for this indicator. Check the creator’s current publication and settings.
General descriptions and classifications are recovered research. Verified details above identify the specific checks we have completed. Check the creator’s current publication for later changes.