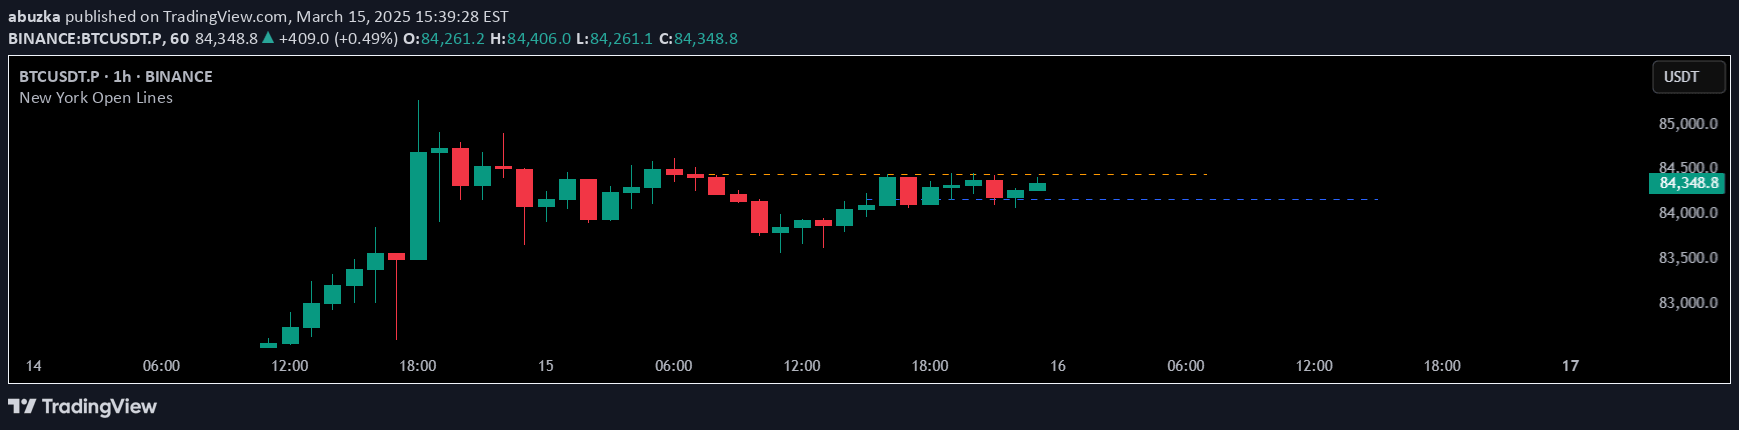
A daily indicator that calculates 0.09% price levels from the first 5-minute candle, helping traders identify early trading zones and potential breakout points.
Explore complementary indicator rolesHow it works
The indicator captures the closing price of the first 5-minute candle between 9:15 and 9:20 AM during each trading day. It then mathematically calculates two horizontal lines: one at 0.09% above the closing price and another at 0.09% below the closing price. These lines are plotted on the chart with the upper line displayed in green and the lower line in red.
The calculation resets daily at 9:15 AM, ensuring that traders always have fresh reference levels based on the most recent market open. After 9:20 AM, these calculated levels remain visible throughout the trading session, providing a consistent framework for analyzing price movement and potential trading opportunities.
Why it may be useful
These calculated levels provide traders with immediate, actionable insights into potential price support and resistance zones right from the market's opening. By identifying these early reference points, traders can make more informed decisions about entry and exit strategies, stop-loss placements, and potential breakout scenarios.
The indicator's simplicity and daily reset mechanism make it a valuable tool for understanding market sentiment and initial price dynamics. Traders can use these levels to gauge market strength, detect potential trend reversals, and manage risk more effectively during the trading day.
When to explore it
This indicator is most effective during active trading sessions, particularly for day traders and scalpers who require quick, precise price reference points. It works best in markets with clear morning trends and when traders want to establish quick directional bias based on the first market movements.
The signal is particularly useful during volatile market conditions or when trading instruments with high liquidity and frequent price fluctuations. Traders should combine this indicator with other technical analysis tools to confirm signals and develop more comprehensive trading strategies.
Keep exploring
What we’ve verified
Access, alerts and repainting behaviour have not been independently verified for this indicator. Check the creator’s current publication and settings.
General descriptions and classifications are recovered research. Verified details above identify the specific checks we have completed. Check the creator’s current publication for later changes.