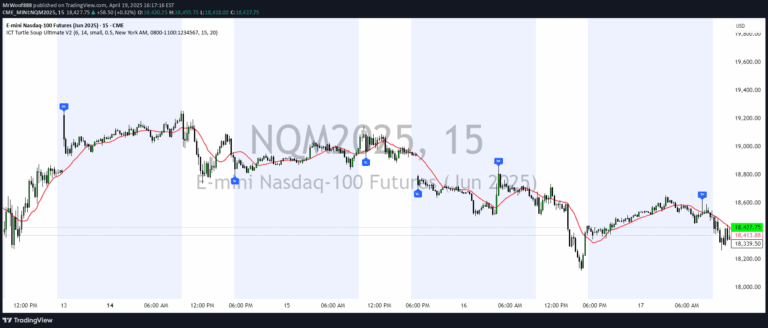
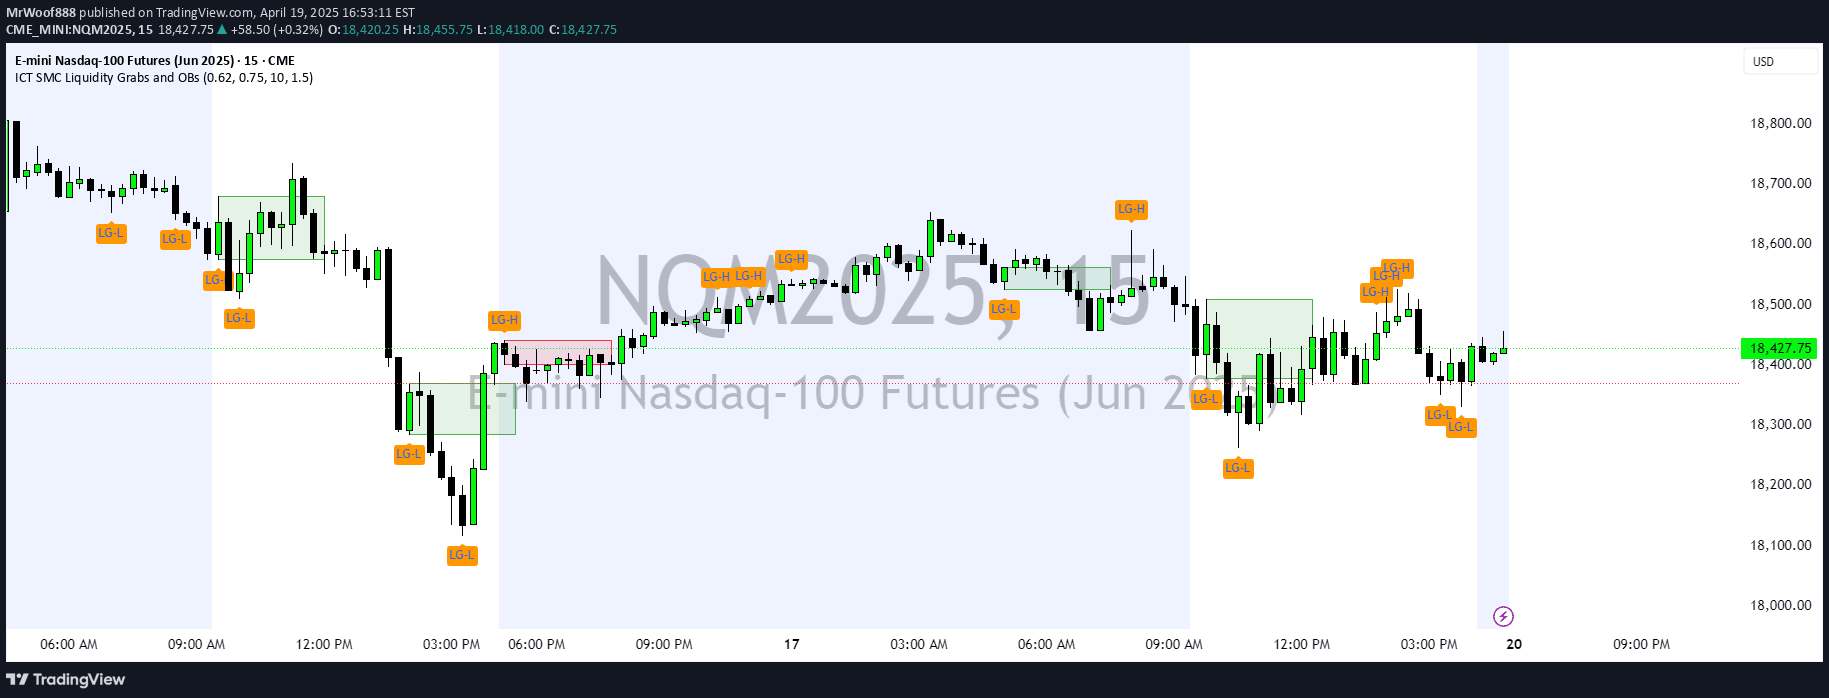
An automated tool to detect the first Fair Value Gap during the stock market's opening range, helping traders identify early market inefficiencies and potential trading opportunities.
Explore complementary indicator rolesHow it works
The signal scans price action between 9:30 and 10:00 AM Eastern Time, specifically looking for the first bullish or bearish Fair Value Gap (FVG) that forms during this critical opening range. Once detected, it draws an extended visual zone on the chart, marking the imbalance created by aggressive market participants.
The tool focuses on a single, time-bound zone to provide a clean and focused view of market inefficiencies. It can be customized with adjustable settings like session time window, zone duration, label properties, and optional retest alerts to suit individual trading preferences.
Why it may be useful
The first FVG represents a potential time distortion or imbalance zone that can provide valuable insights into market behavior and institutional trading activity. By highlighting this early inefficiency, traders can gain anticipatory insights into intraday price action, rather than relying solely on reactive analysis.
This tool is particularly useful for new traders learning to understand market structure and institutional trading dynamics. It helps traders observe how price interacts with the opening range zone, whether it acts as support, resistance, or gets traded through later in the trading session.
When to explore it
This signal is most effective during the first 30 minutes of the trading day, specifically between 9:30 and 10:00 AM Eastern Time. It is particularly valuable for traders focusing on short-term, intraday strategies who want to align their entries with Smart Money concepts and market structure.
Traders can use this tool for scalping, journaling market behavior, planning trade entries, and understanding liquidity dynamics. It is especially beneficial for those looking to develop a systematic approach to trading the opening range and identifying potential high-probability setups.
Keep exploring
What we’ve verified
Access, alerts and repainting behaviour have not been independently verified for this indicator. Check the creator’s current publication and settings.
General descriptions and classifications are recovered research. Verified details above identify the specific checks we have completed. Check the creator’s current publication for later changes.