
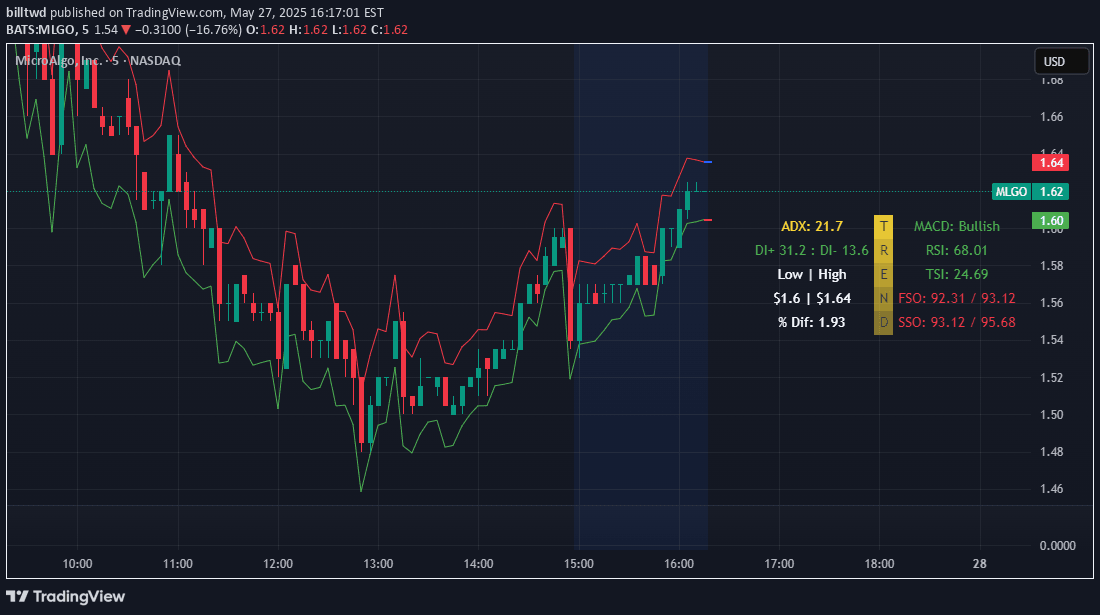
A comprehensive trading signal combining five technical indicators including ATR, TSI, RSI, and Stochastic to analyze price potential, trend strength, and market direction with color-coded visual insights.
Explore complementary indicator rolesHow it works
This trading signal integrates five different technical indicators to provide a comprehensive market analysis. ATR14 measures market volatility, helping traders understand potential price ranges. The True Strength Index (TSI) reveals trend momentum by comparing price movements.
Relative Strength Index (RSI) indicates overbought or oversold conditions. Fast and Slow Stochastic indicators help identify potential trend reversals and momentum shifts. By combining these indicators, traders can gain a multi-dimensional view of market dynamics, assessing trend strength, potential price movements, and possible entry or exit points
Why it may be useful
This multi-indicator approach offers traders a more robust and nuanced market analysis compared to single-indicator strategies. By incorporating different technical perspectives, traders can reduce the risk of false signals and increase confidence in their trading decisions.
The comprehensive nature of this signal allows for a more holistic understanding of market conditions, helping traders identify potential opportunities more accurately. The color-coded presentation makes it easier to interpret complex market information quickly and intuitively
When to explore it
This trading signal is most effective in markets with clear trend characteristics and moderate volatility. It works best for traders seeking a comprehensive analysis that goes beyond single-indicator approaches. Ideal for swing and day traders who want to understand both trend direction and momentum.
Particularly useful in markets like forex, stocks, and cryptocurrency, where price movements can be complex and multifaceted. Traders should combine this signal with additional confirmation methods and risk management strategies
Keep exploring
What we’ve verified
Access, alerts and repainting behaviour have not been independently verified for this indicator. Check the creator’s current publication and settings.
General descriptions and classifications are recovered research. Verified details above identify the specific checks we have completed. Check the creator’s current publication for later changes.


