
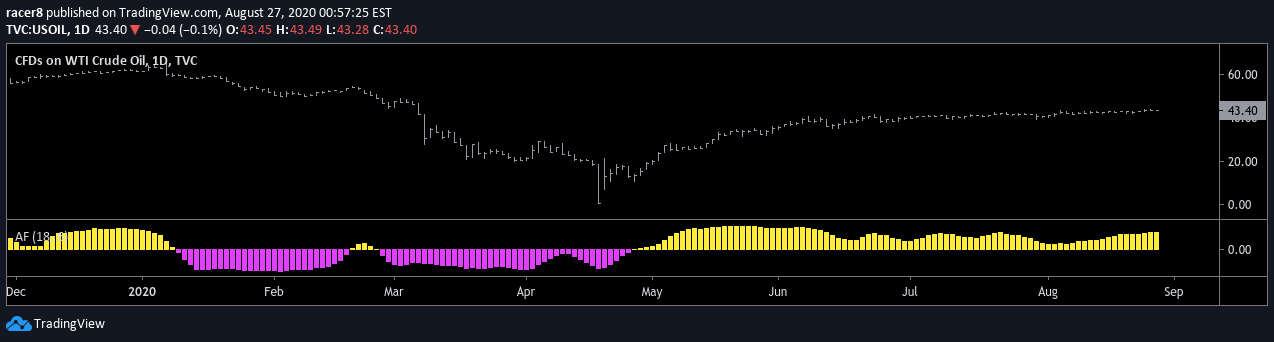
Average Force is an oscillating indicator that calculates market sentiment by measuring price dynamics and trend strength through smoothed calculations of market movement.
Explore complementary indicator rolesHow it works
The Average Force indicator calculates market sentiment by analyzing price movement and force behind price changes. It first computes the raw force of price action by comparing current price to previous price levels. Then, it applies a smoothing mechanism to reduce noise and create a more reliable signal.
The calculation involves determining the directional strength of price movement and averaging these force measurements over a specified period. By smoothing the raw data, the indicator provides a clearer view of underlying market momentum. The smoothing process helps traders identify trend strength and potential sentiment shifts more effectively
Why it may be useful
Traders find the Average Force indicator valuable because it offers insights into market sentiment and trend dynamics. By quantifying the force behind price movements, it helps traders understand the strength of current market trends. The indicator can reveal potential trend reversals or continuations before they become apparent in price action.
It provides a nuanced view of market psychology, showing not just price direction but the momentum driving those changes. This can be particularly useful in volatile or uncertain market conditions where understanding underlying sentiment is crucial. The smoothed nature of the indicator reduces false signals and offers more reliable trend information
When to explore it
The Average Force indicator works best in markets with clear trending characteristics, such as forex, commodities, and major stock indices. It is most effective during periods of sustained price movement, either in uptrends or downtrends. Traders should use this indicator in combination with other technical analysis tools to confirm signals and reduce false positives.
It performs well in timeframes ranging from daily to weekly charts, making it suitable for swing and intermediate-term trading strategies. The indicator is particularly useful when markets are showing consistent directional movement. Traders should be cautious during choppy or range-bound market conditions where momentum signals might be less reliable
Keep exploring
What we’ve verified
Access, alerts and repainting behaviour have not been independently verified for this indicator. Check the creator’s current publication and settings.
General descriptions and classifications are recovered research. Verified details above identify the specific checks we have completed. Check the creator’s current publication for later changes.


