
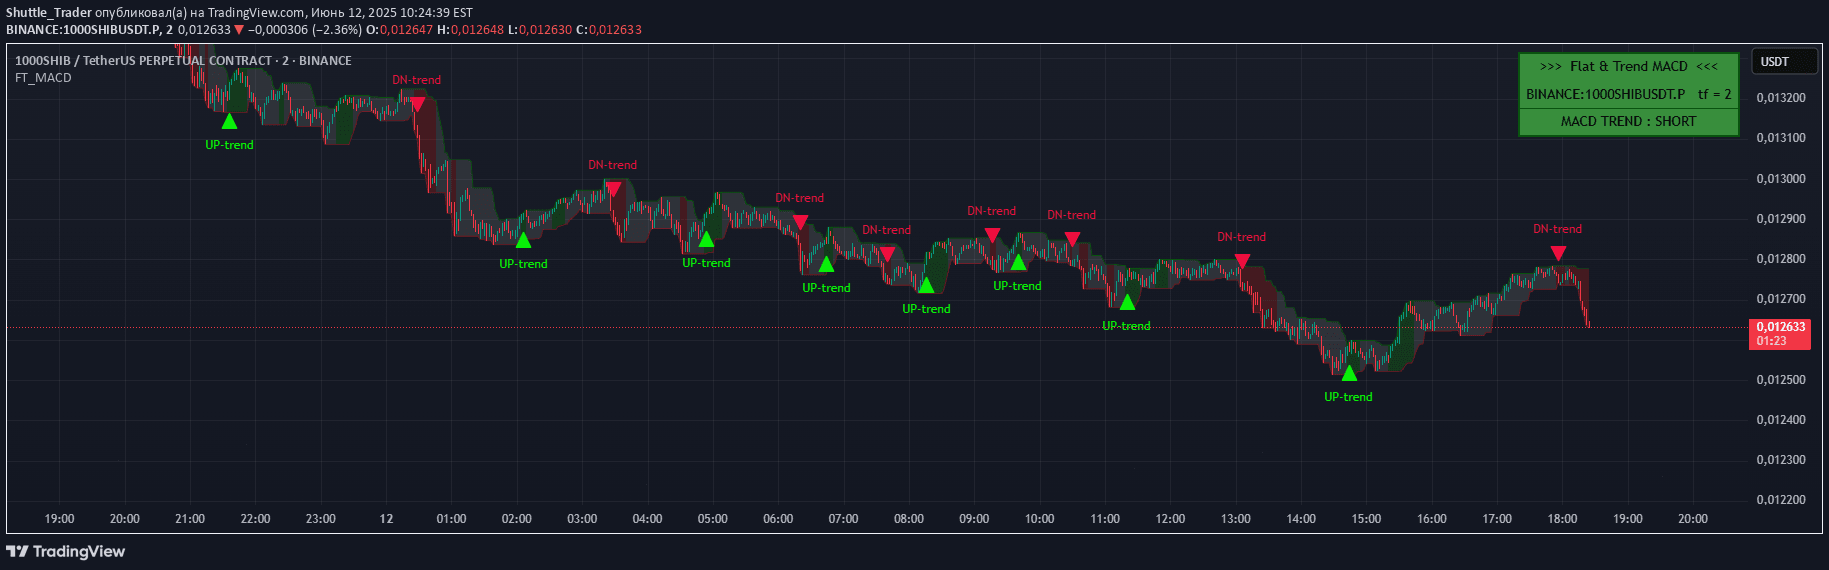
A MACD-based indicator that identifies trend direction, buyer and seller zones, and flat market conditions with visual signals and color-coded backgrounds.
Explore complementary indicator rolesHow it works
The indicator tracks the MACD oscillator relative to zero, establishing an uncertainty zone calculated at 50% of the average MACD deviation for a short period. When the MACD value moves beyond this uncertainty zone positively, it generates a buy signal represented by a green triangle on the chart.
Conversely, when the MACD value becomes negative and exits the uncertainty zone, a sell signal appears as a red triangle. The trend direction is further highlighted by color-coding the price channel background, providing traders with a clear visual representation of market dynamics.
Why it may be useful
This MACD indicator offers traders a comprehensive view of market sentiment by clearly distinguishing between buyer-dominated, seller-dominated, and uncertain market conditions. By incorporating an uncertainty zone, it significantly reduces false trading signals, helping traders make more informed decisions and avoid unnecessary market noise.
The visual elements like color-coded backgrounds, triangular signals, and an informative scoreboard provide traders with an intuitive and quick understanding of market trends, making complex technical analysis more accessible and easier to interpret.
When to explore it
The indicator is most effective in markets with clear trending characteristics, where price movements show distinct directional momentum. It performs exceptionally well across various financial instruments and timeframes, making it versatile for different trading styles and strategies.
Traders should particularly utilize this tool when seeking to confirm trend changes, identify potential entry and exit points, and understand the underlying market psychology. Its built-in alert system and visual signals make it especially useful for traders who want a comprehensive yet straightforward approach to trend analysis.
Keep exploring
What we’ve verified
Access, alerts and repainting behaviour have not been independently verified for this indicator. Check the creator’s current publication and settings.
General descriptions and classifications are recovered research. Verified details above identify the specific checks we have completed. Check the creator’s current publication for later changes.


