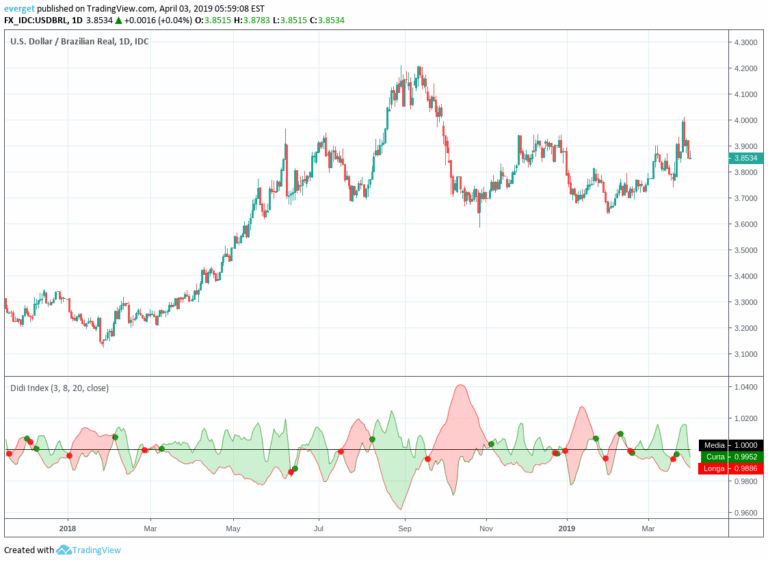
Didi Index
A Brazilian technical analysis indicator developed by Odir Aguiar, similar to MACD, designed to identify trend momentum and potential market reversals through specialized calculations.
Explore 11,183 indicators. Filter beyond the obvious.
Discover the tools that fit the way you trade.
11,183 tools to explore
A Brazilian technical analysis indicator developed by Odir Aguiar, similar to MACD, designed to identify trend momentum and potential market reversals through specialized calculations.
A comprehensive market analysis tool tracking cross-market correlations and equity factor performance across multiple assets to provide probabilistic insights into macro market regimes and potential future movements.
A chart pattern library that identifies and visualizes specific trading patterns using zigzag pivot points, helping traders detect and analyze complex market structures.
A Pine Script indicator that identifies flat market conditions and low ADX trends, helping traders recognize periods of market consolidation and potential trading risks.
A hybrid trading indicator combining ADX and Vortex with range mixer and RSI filter to analyze trend strength, momentum, and market direction.
A comprehensive macro analysis tool tracking multiple assets and market regimes to provide insights into market performance, risk states, and potential economic trends.
A multi-layered moving average indicator that uses multiple time-period averages and forecasting techniques to analyze market trends and predict potential price movements.
An advanced Money Flow Index indicator that identifies market trends, momentum, and flat market conditions by analyzing price action and money flow direction.
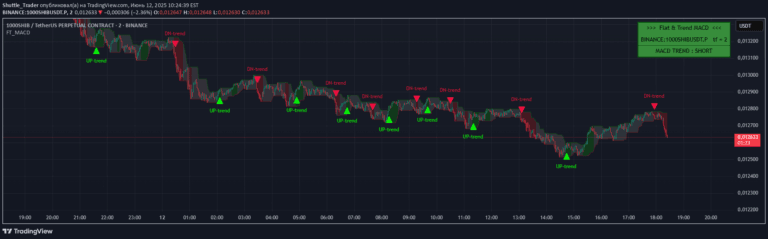
A MACD-based indicator that identifies trend direction, buyer and seller zones, and flat market conditions with visual signals and color-coded backgrounds.
A trading indicator identifying price inefficiencies through Flat Top/Bottom Candles, highlighting zones where market manipulation might occur and potential price rebalancing opportunities.
Treasury Yields Heatmap is a dynamic tool tracking bond values and yield curve status across different countries using Pearson's linear regression coefficient.
A custom trading indicator combining Kaufman's Adaptive Moving Average (KAMA) with Vertical Horizontal Filter and linear regression to identify market trends and potential entry points.
Likes, views, and comments are historical TradingView snapshots. They describe attention, not trading performance.