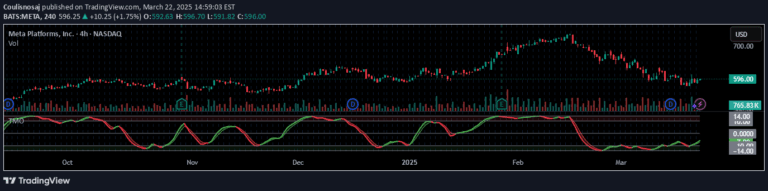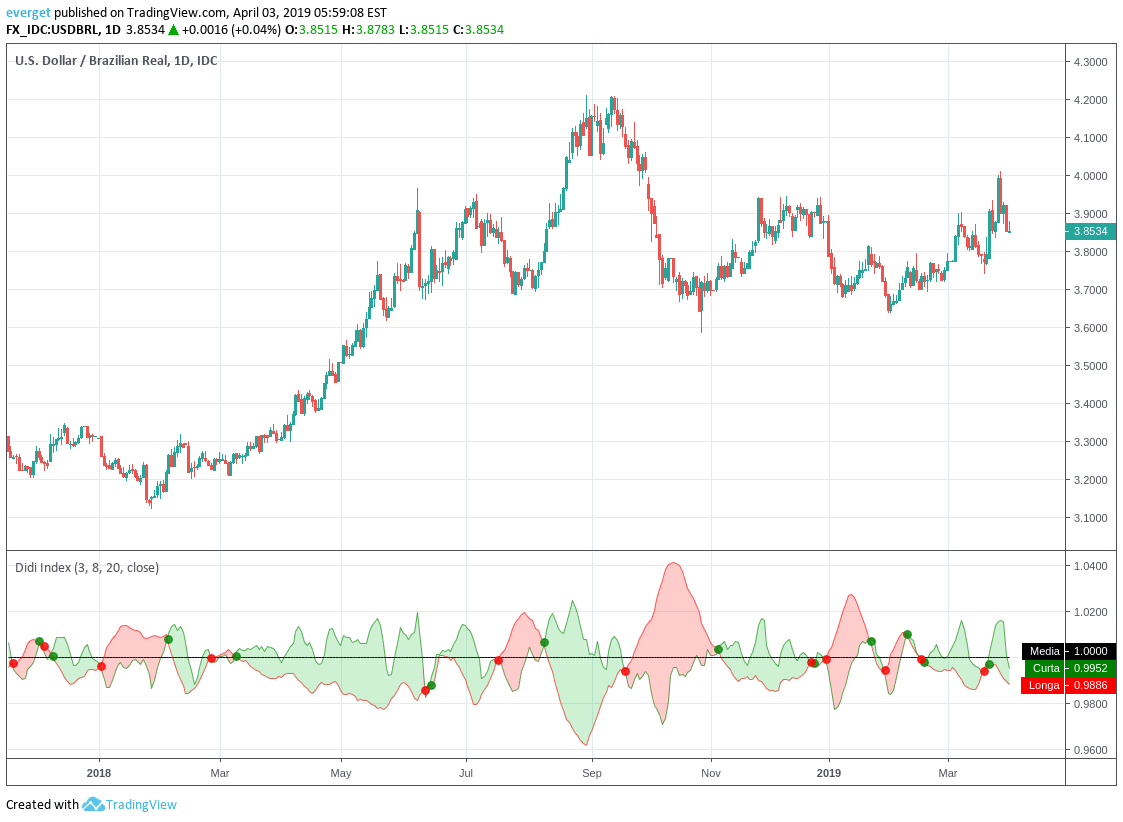
A Brazilian technical analysis indicator developed by Odir Aguiar, similar to MACD, designed to identify trend momentum and potential market reversals through specialized calculations.
Explore complementary indicator rolesHow it works
The Didi Needles indicator works by analyzing price momentum and trend direction through comparative calculations. It likely compares multiple moving averages or exponential moving averages to generate trading signals. The indicator calculates the difference between different price averages to highlight potential trend changes.
By tracking the relationship between these averages, traders can identify momentum shifts. The calculation method creates visual representations of market movement. Crossovers and divergences are key components of its signaling mechanism. The indicator helps traders understand underlying market dynamics
Why it may be useful
The Didi Needles indicator provides traders with insights into market momentum and potential trend reversals. It offers a systematic approach to understanding price movements beyond simple visual analysis. Traders can use this method to make more informed trading decisions by identifying potential entry and exit points.
The indicator helps reduce emotional trading by providing objective measurements of market behavior. Its Brazilian origins bring a unique perspective to technical analysis methodologies. By combining multiple calculation techniques, it offers a comprehensive view of market trends. The signal can help traders manage risk more effectively
When to explore it
The Didi Needles indicator works best in trending markets with clear directional movements. It is most effective in markets with moderate to high volatility where momentum shifts are frequent. Traders should use this indicator in conjunction with other technical analysis tools for confirmation.
It is particularly useful during strong bullish or bearish market conditions. The signal provides more reliable insights in liquid markets with consistent trading volumes. Traders should pay special attention to crossover points and momentum changes. The indicator is less effective in completely flat or range-bound market conditions
Keep exploring
What we’ve verified
Access, alerts and repainting behaviour have not been independently verified for this indicator. Check the creator’s current publication and settings.
General descriptions and classifications are recovered research. Verified details above identify the specific checks we have completed. Check the creator’s current publication for later changes.