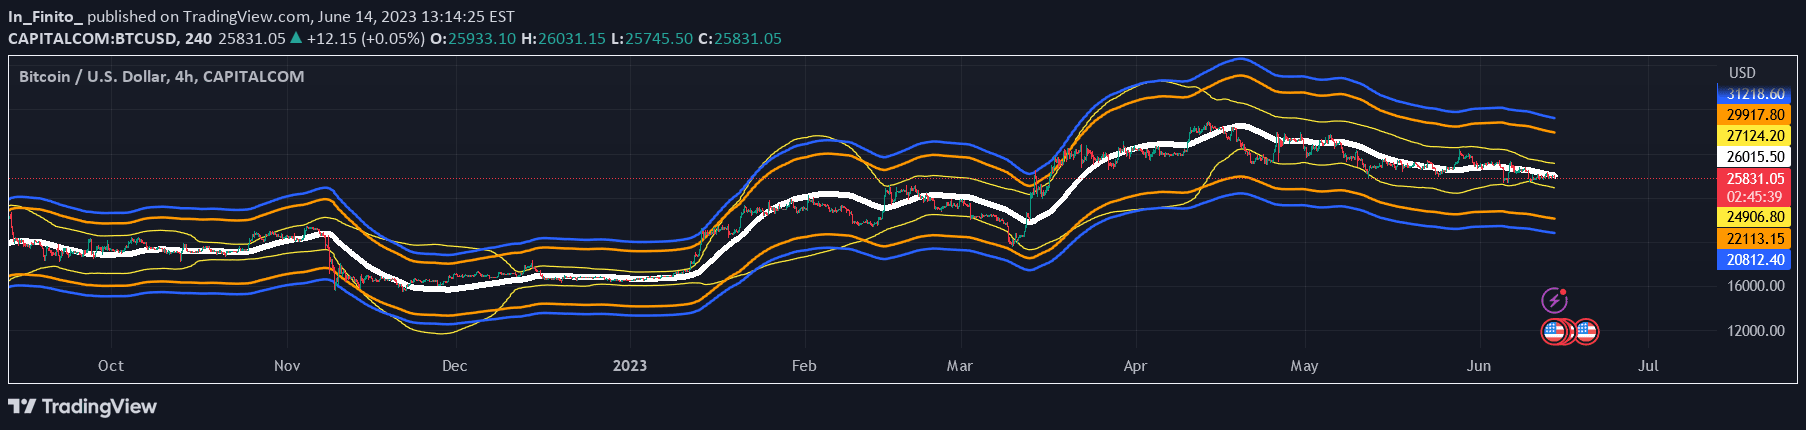
Full Spectrum Delta Bands provide a comprehensive market analysis tool that extends beyond traditional Bollinger Bands by incorporating full OHLC data for more accurate trend and volatility insights.
Explore complementary indicator rolesHow it works
The Full Spectrum Delta Bands calculate price deviations using both Open, High, Low, and Close (OHLC) data instead of just closing prices. This comprehensive approach creates bands that more accurately represent market dynamics by considering the entire price range of each candlestick.
The indicator introduces a Delta Flip mechanism that visually marks shifts between OHLC and Close-based bands, highlighting potential trend reversals and volatility changes. By using customizable sensitivity and deviation multiplier settings, traders can adapt the indicator to different timeframes and trading styles, from short-term scalping to long-term trend analysis.
Why it may be useful
Traditional technical indicators often rely on limited price data, which can lead to incomplete or misleading market insights. The Full Spectrum Delta Bands provide a more holistic view of market behavior by incorporating comprehensive price range information, offering traders a more nuanced understanding of potential trend shifts and volatility.
By offering visual cues through color changes and adaptable settings, this indicator empowers traders to make more informed decisions across various market conditions and timeframes. The ability to customize sensitivity allows traders to fine-tune the indicator to their specific trading strategy and risk tolerance.
When to explore it
The Full Spectrum Delta Bands are most effective in markets with significant price volatility and complex price action. They work exceptionally well for traders seeking a more comprehensive market analysis tool that goes beyond traditional single-metric indicators.
Different deviation settings make this indicator versatile across multiple timeframes and trading styles. Lower deviation values (1σ-1.5σ) are ideal for short-term scalping on 5-15 minute charts, while higher values (2.5σ-3σ) suit long-term trend analysis on weekly or monthly charts, making it a flexible tool for diverse trading approaches.
Keep exploring
What we’ve verified
Access, alerts and repainting behaviour have not been independently verified for this indicator. Check the creator’s current publication and settings.
General descriptions and classifications are recovered research. Verified details above identify the specific checks we have completed. Check the creator’s current publication for later changes.