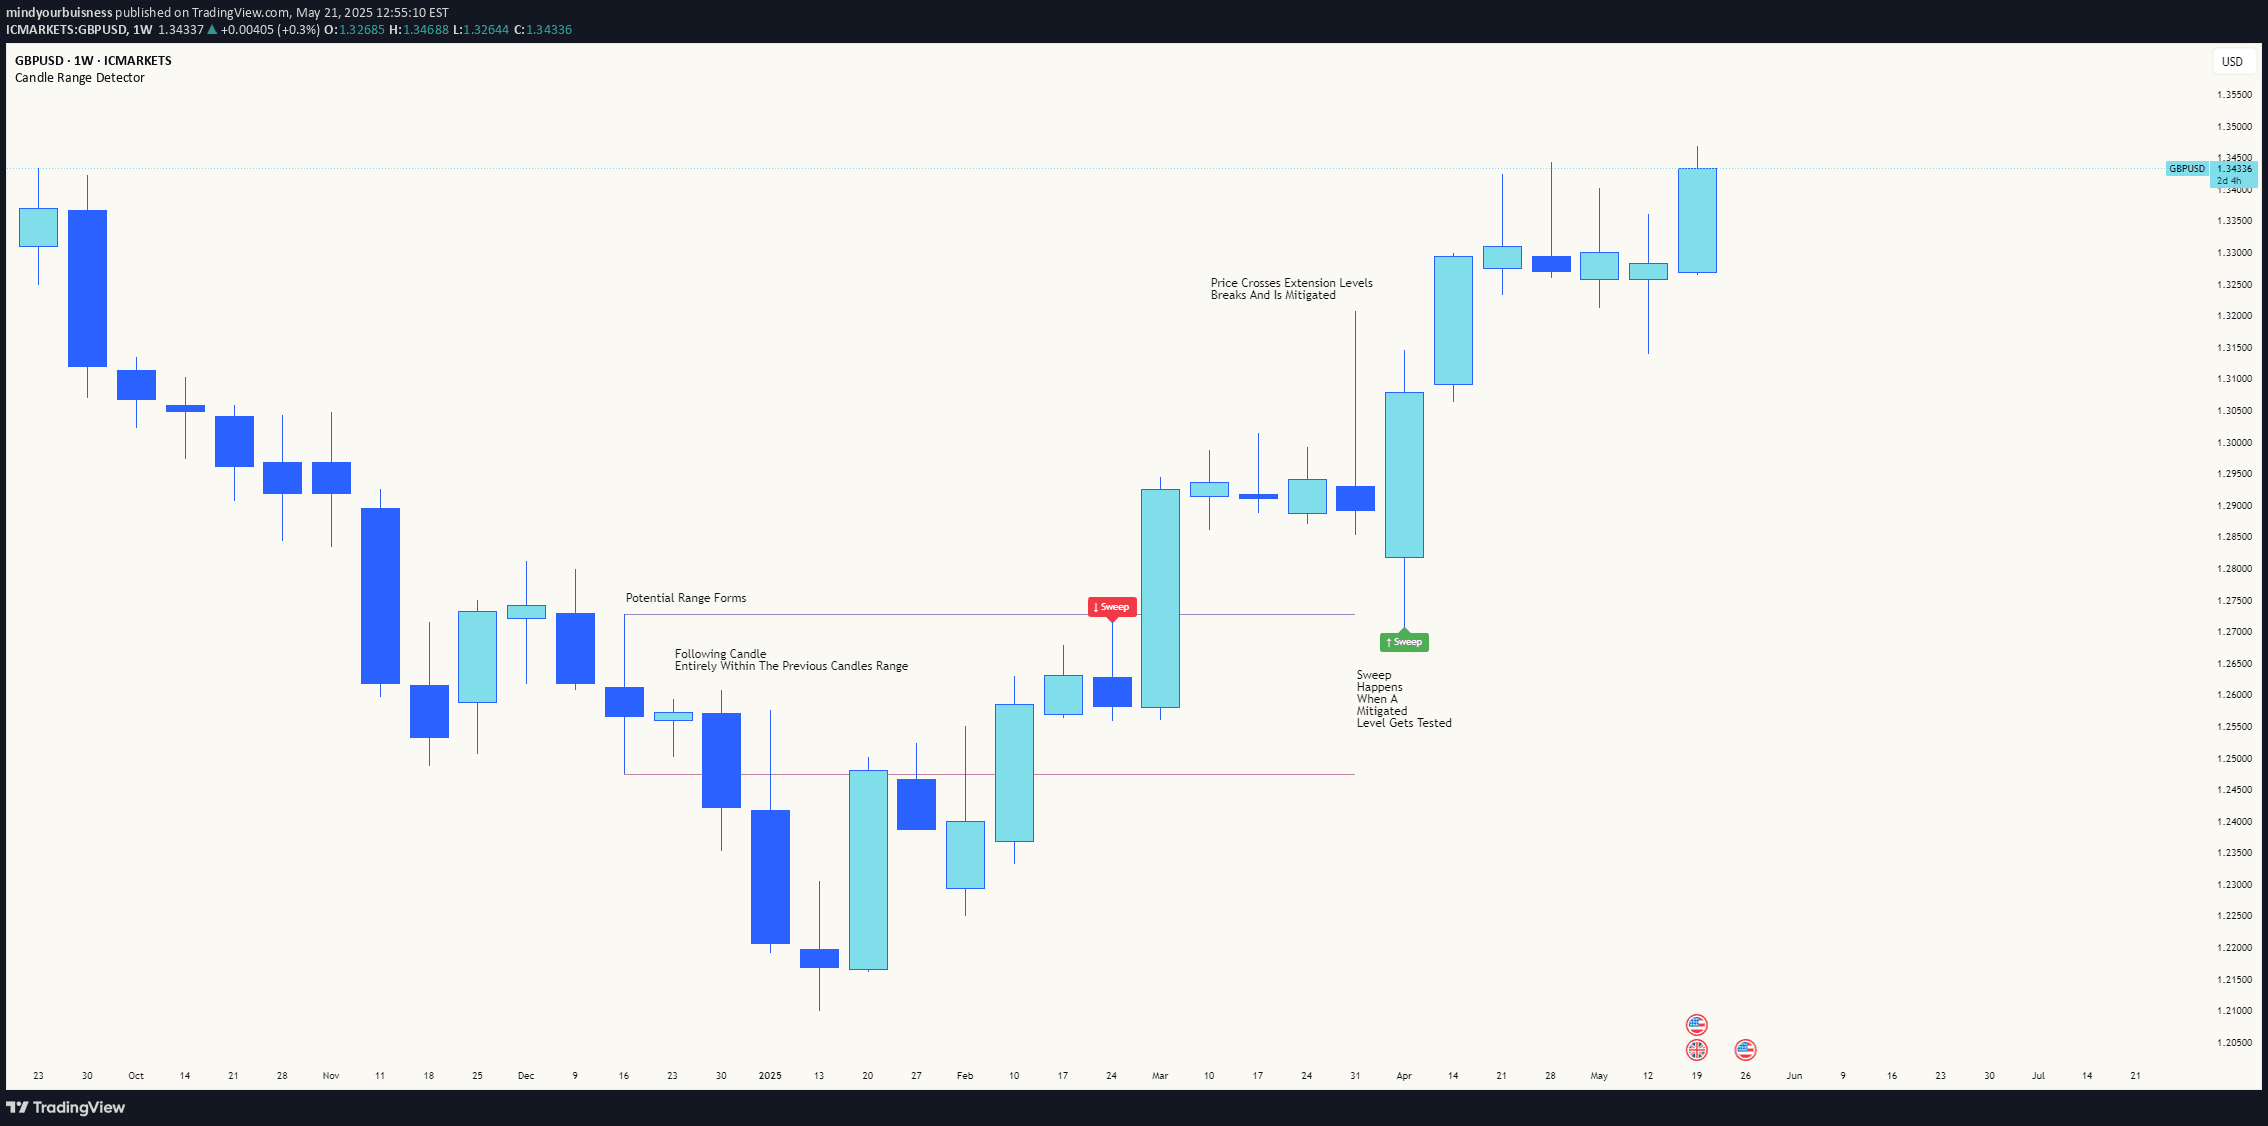
A trading tool that identifies price areas with minimal trading activity, highlighting potential market imbalances and zones of potential price reversal or continuation.
Explore complementary indicator rolesHow it works
The Fair Value Gap (FVG) Detector analyzes price charts to identify areas where trading activity has been minimal, creating visual markers for these price ranges. It scans historical price movements to detect zones where there are significant gaps between price candles, indicating potential market imbalances.
By automatically detecting and marking these liquidity gaps, the indicator provides traders with a graphical representation of potential trading opportunities. These gaps are identified by looking at the space between consecutive candlesticks where there is little or no overlapping price action, which can signal potential areas of future price interest.
Why it may be useful
Fair Value Gaps are crucial for traders because they reveal potential areas of market inefficiency and price imbalance. These gaps represent zones where the market might have overlooked certain price levels, creating opportunities for strategic entries and exits based on anticipated price behavior.
By highlighting these areas, traders can gain insights into potential support and resistance levels that might not be immediately apparent through traditional technical analysis. The FVG Detector helps traders understand market dynamics by exposing areas where price might naturally gravitate or potentially reverse.
When to explore it
The Fair Value Gap Detector is most effective in markets with clear price movements and distinct candlestick patterns. It works best in liquid markets like forex, stocks, and major cryptocurrency pairs where price action is more predictable and gaps are more likely to form and be meaningful.
Traders should use this indicator in conjunction with other technical analysis tools to confirm potential trading signals. It is particularly useful during trending markets or periods of consolidation where price is more likely to respect these identified liquidity zones.
Keep exploring
What we’ve verified
Access, alerts and repainting behaviour have not been independently verified for this indicator. Check the creator’s current publication and settings.
General descriptions and classifications are recovered research. Verified details above identify the specific checks we have completed. Check the creator’s current publication for later changes.